The gap
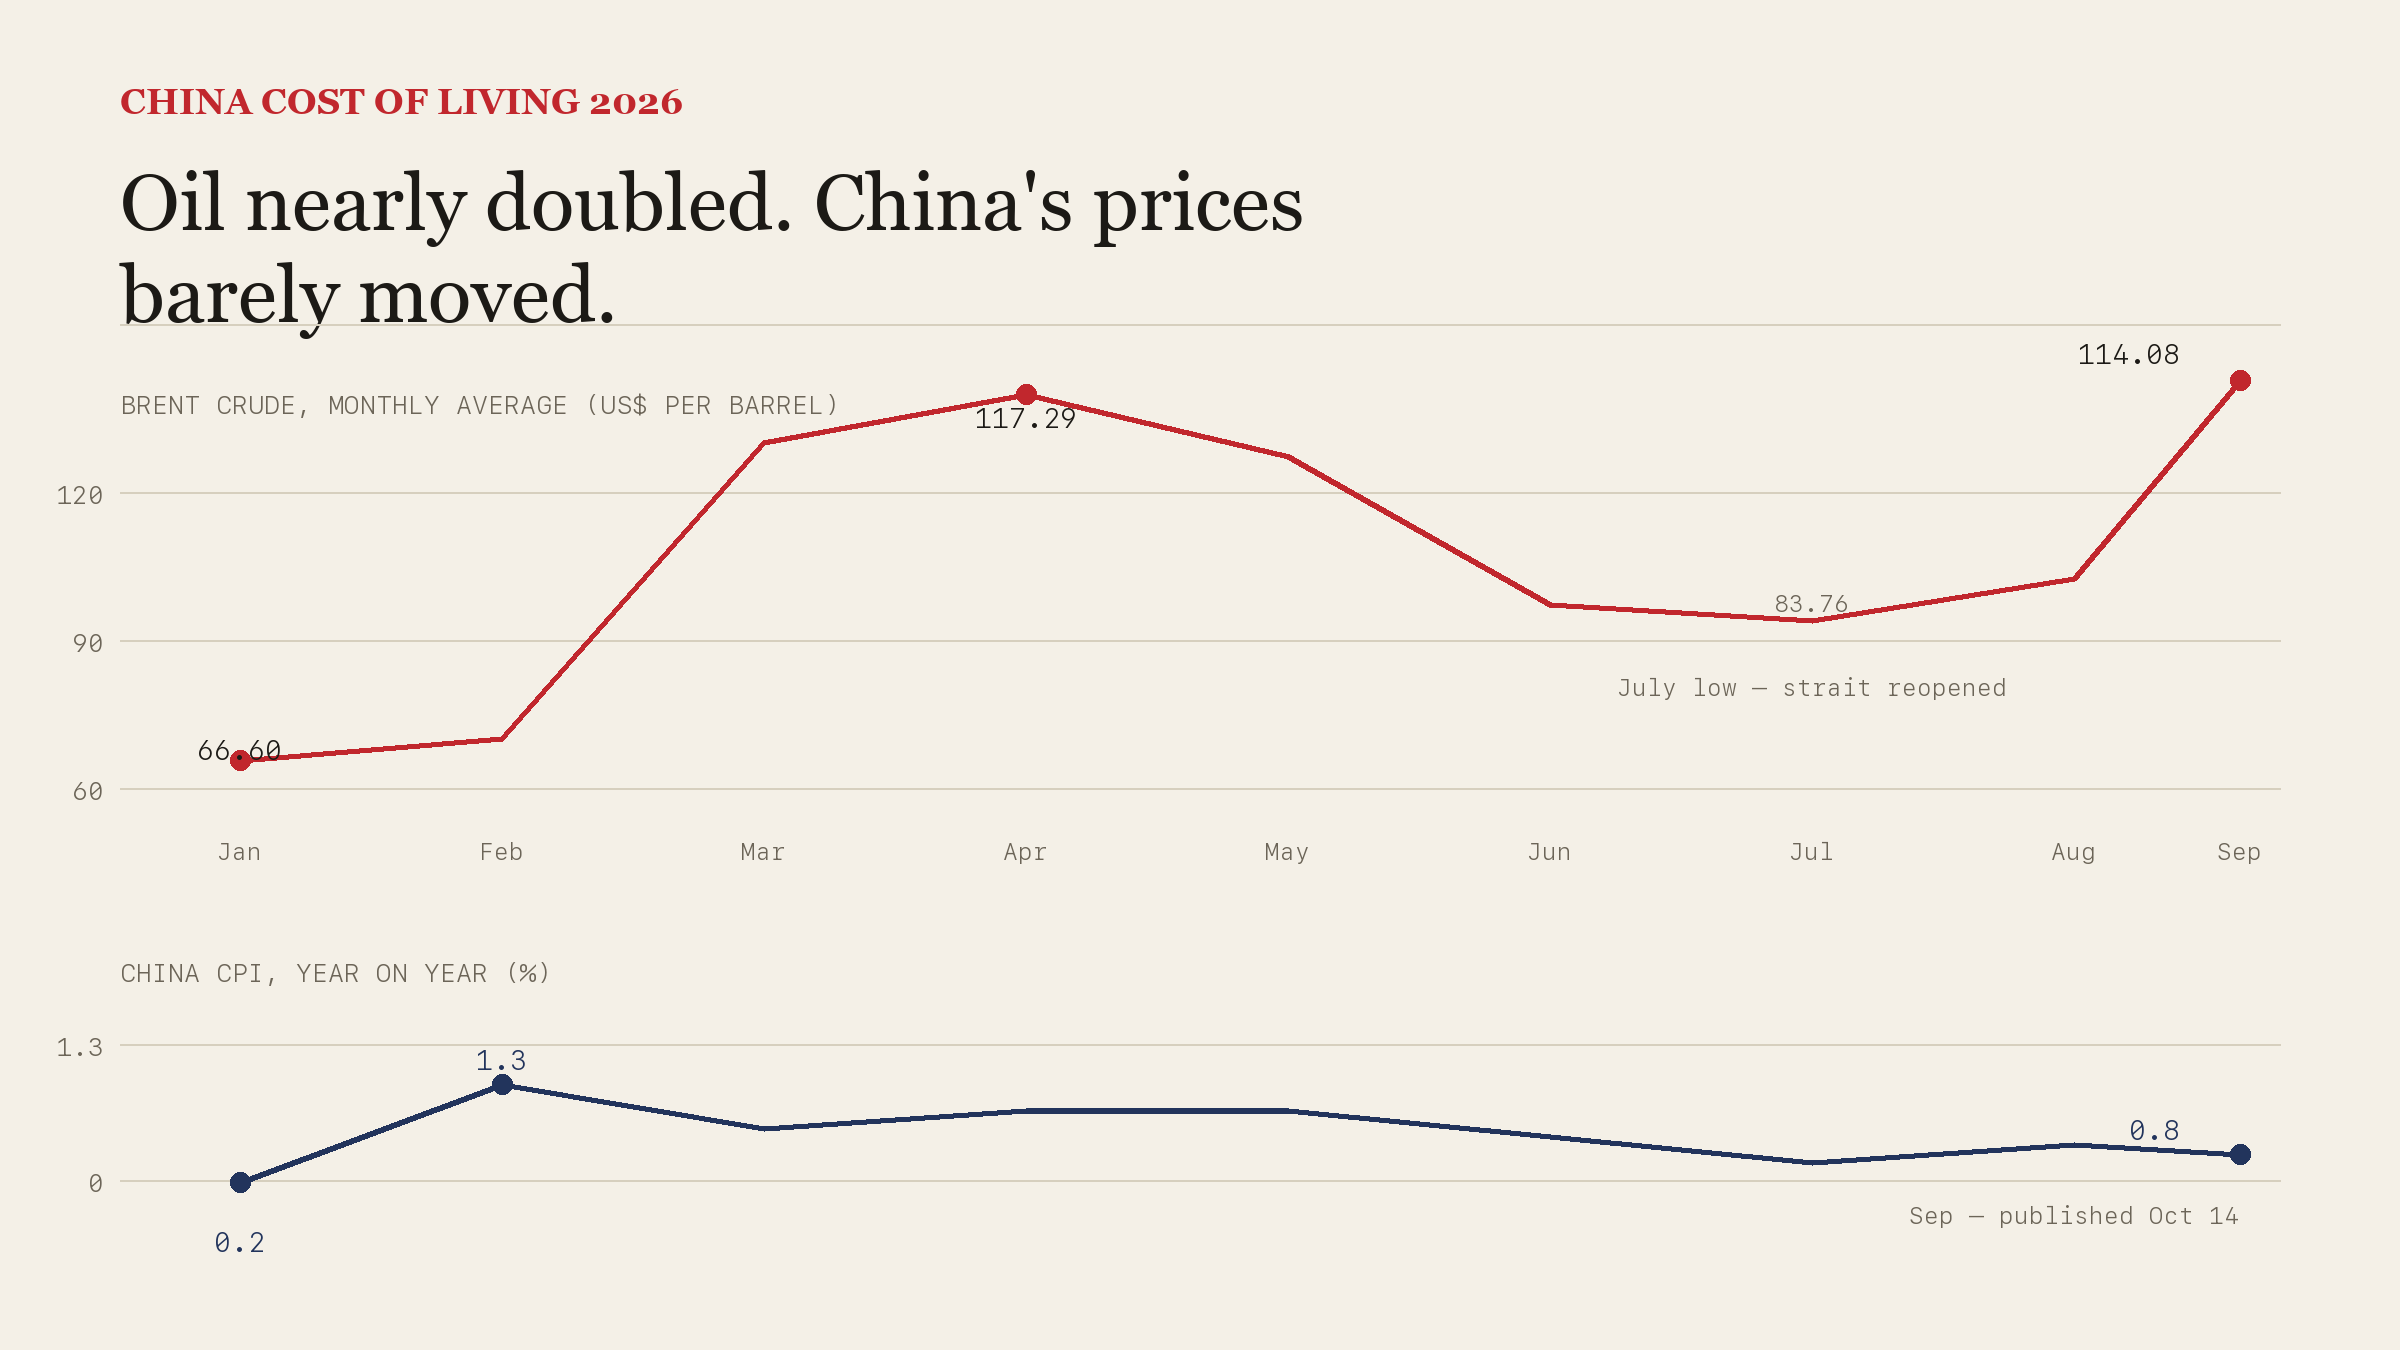
Brent crude started 2026 at $66.60 a barrel. By April it had averaged $117.29. By July it had fallen back to $83.76. By September it was back above $114 — roughly 1.6 times its January–February average of $68.75, and on 15 September a single daily print hit $130.80.
This was not a smooth climb. It was two spikes with a valley between them, and the valley matters: when the strait reopened in late June, Brent fell to $70.46 on 30 June, below the January–February average. In yuan terms that was the cheapest Chinese month of the year. For anyone earning dollars it was the opposite, because a strong yuan meant each dollar bought less. Either way the window closed in July.
Over the same nine months, China's consumer price index never left a narrow band:
| Month | Brent (US$/bbl) | China CPI (YoY) | USD/CNY |
|---|---|---|---|
| Dec 2025 | 61.60 | 0.8% | — |
| Jan 2026 | 66.60 | 0.2% | 6.9693 |
| Feb 2026 | 70.89 | 1.3% | 6.9081 |
| Mar 2026 | 103.13 | 1.0% | 6.8957 |
| Apr 2026 | 117.29 | 1.2% | 6.8344 |
| May 2026 | 107.14 | 1.2% | 6.7978 |
| Jun 2026 | 85.40 | 1.0% | 6.7760 |
| Jul 2026 | 83.76 | 0.5% | 6.7906 |
| Aug 2026 | 91.08 | 0.8% | — |
| Sep 2026 | 114.08 | pending 14 Oct | ~6.74 |
Futures contracts and other series report different monthly averages for the same months — WTI futures, for instance, printed materially lower April and May figures. If you find a different number for a month here, the difference is almost certainly series choice, not error.
Oil rose 71% from January to September. China's CPI averaged 0.90% across January–August. The yuan strengthened about 3.2% over the same period and touched 6.6936 on 21 September, its strongest since January 2023. That broad calm is real — but it is not the whole picture. At the petrol pump, 92-octane rose from about ¥6.7 to past ¥8.6 a litre — about 28% — over the same months, the one line item that moved with crude. The next section separates the two.
Oil nearly doubled. China's price level barely moved.
Why China stayed out of it
Two forces did most of the protecting, and both are structural rather than lucky.
Energy mix. China does not control the Strait of Hormuz, and it does not need to. Roughly three-quarters of the oil transiting the strait is destined for China, India, Japan and South Korea combined, but the exposure is not equal. China's own electricity supply leans on coal and domestic hydro rather than Gulf gas, and the result shows up in this site's electricity data: national wind capacity went from 0.74 GW in 2004 to 62.4 GW by 2011, and total installed power capacity reached roughly 2.2 TW by 2020 across all sources, with coal still the largest single source. A country generating most of its own electricity does not inherit the price of someone else's imported gas.
Import reduction. China cut crude oil imports by more than 40% year-on-year in June 2026 — a 41.3% drop to 29.27 million tonnes per the General Administration of Customs — drawing on domestic inventories instead. ECA International, the global mobility cost authority, named China among the least affected markets in its June 2026 briefing, citing the broader energy mix and lower reliance on strait flows.
On ECA's own cost-of-living basket, prices in China rose 2% between September 2025 and March 2026 while the global average rose from 2.8% to 3.7%. That basket measures living costs, not the consumer price index, so the two figures are not directly comparable — but the direction is the same.
The caveat worth stating plainly: insulation is not immunity. Chinese CPI was negative as recently as September 2025 (−0.27%), so 2026's positive readings mark an exit from deflation, not an inflation problem. Core CPI, which strips food and energy, has settled into a 0.9%–1.2% range since March — 1.2% in April, 1.1% in March and May, 1.0% in June and August, 0.9% in July (NBS) — after a 1.8% February reading flattered by the Spring Festival. That is a gentle, non-energy story, and the number to watch if it changes. The insulation does, however, have one clear breach: petrol and diesel, which track crude through the state pricing mechanism and rose with it. That breach — and who it hits — is the subject of the next section.
The two channels that transmitted
The macro gap only matters if it shows up on a bill. For most households — renters on public transit, users of metered utilities — it did not. But the shock did land in two places that touch a large share of urban China: the fuel pump, and the aviation fuel surcharge.
Petrol and diesel — the channel that did transmit
China's refined-oil prices are not market-spot. They are set by a state mechanism that tracks a basket of international crude (Brent, Dubai, Minas, weighted 4:3:3) and adjusts every ten working days, with a $40 floor, a $130 ceiling, and a profit-margin taper above $80. The mechanism dampens single-day spikes — it even delivered a cut of 555 yuan/tonne in late April 2026 even as headlines screamed — but across a sustained spike it transmits. And 2026 was sustained.
Verified 2026 trajectory (provincial DRC / NDRC retail-ceiling notices, 92-octane):
- 92-octane opened 2026 in the ¥6.7–6.9/L band (the 20 January first adjustment) and sat at ¥8.25/L in mid-September (Xiamen, the year's 12th upward adjustment), reaching ¥8.62/L by 24 September (Henan) and ¥8.63/L in Guangdong by late September. 95-octane touched ¥9.21/L.
- From the 20 January adjustment to late September, 92-octane rose by roughly ¥1.9 a litre — about 28% — while eleven upward adjustments added ¥4,475/tonne to petrol and ¥4,320/tonne to diesel across the year to late September.
- A 50-litre fill cost roughly ¥95 more in late September than in January (Guangdong spread).
The 28% is measured from the 20 January 2026 NDRC retail ceiling — the first pricing adjustment of the year — to the 24–29 September ceiling. The 6 January adjustment was shelved because the crude-basket move fell below the ¥50/tonne threshold, so 20 January is the year's first effective retail ceiling. The December 2025 baseline was marginally lower, so a December-to-September measure would read slightly above 28%. Either way, crude rose about 71% over the same span while the pump rose about 28%: the mechanism clipped roughly 60% of the move.
Why it matters: a private car doing 1,000 km a month pays roughly ¥150 more a month for fuel than at the start of the year. For the large share of urban households that own a car, this is the oil spike, in full.
Aviation fuel — the second channel
Domestic flights are the second transmission channel, after petrol. Chinese domestic fares carry a fuel surcharge outside the base fare — this site's domestic flights page records a 2026 range of ¥10–220 per person. In 2026 it moved hard: from a low base early in the year it was raised to ¥60/¥120 by April and peaked at ¥90/¥170 on 16 May — about +50% on the short-haul band from April to the May peak — before easing to ¥80/¥150 on 5 June, the year's first cut.
Set against that, high-speed rail runs at roughly $0.06 per kilometre across a 50,000 km network reaching 97% of cities above 500,000 people. When air fares carry a fuel surcharge, the train does not. Guangzhou–Shenzhen is half an hour and costs less than a short-haul Western taxi. For anyone whose budget is sensitive to energy prices, the substitution is already built into China's transport network.
Both the ¥10–220 surcharge range and the $0.06 per kilometre figure are carried on this site's domestic flights and high-speed rail pages, converted at the standing ¥7.2 = $1 rate.
The seven cities, at a glance
The two channels above are the only places the 2026 energy shock landed on a household bill. Everything else on these cities' pages stayed where it was. This directory connects the argument to the data behind it — every city name opens its full cost-of-living page.
| City | 92# petrol, 20 Jan → late Sep 2026 | What held flat (documented on the city page) |
|---|---|---|
| Beijing | ¥6.70 → ¥8.61 (+28.5%) | Metro ¥3 since 2014; centre rent ¥7,596; utilities ¥239/mo |
| Shanghai | ¥6.67 → ¥8.57 (+28.5%) | Metro at the national ¥3 floor; no district heating |
| Guangzhou | ¥6.73 → ¥8.63 (+28.2%) | Metro at the national ¥3 floor; HSR substitute (Guangzhou–Shenzhen ~30 min) |
| Shenzhen | ¥6.73 → ¥8.63 (+28.2%) | Metro at the national ¥3 floor; HSR network |
| Chengdu | ¥6.81 → ¥8.70 (+27.8%) | Centre rent ¥2,700; all-in $817 (87% below New York) |
| Harbin | ¥6.72 → ¥8.58 (+27.7%) | Heating billed once a season, admin-set; rent-to-income 36% |
| Kunming | ¥6.85 → ¥8.76 (+27.9%) | Rent-to-income 28%, lowest of tracked cities; metro-served |
Sources: provincial DRC / NDRC retail-ceiling notices for 20 January and 24–29 September 2026, cross-checked against qiyoujiage.com and xiaoxiongyouhao.com provincial tables. Guangzhou and Shenzhen share Guangdong's provincial price. The gradient is small — about 0.18 yuan across all seven — but it is the real geography of Chinese pump prices, and it is the one place the 2026 energy shock reached a Chinese household's bill. The "what held flat" column draws on each city's own page; none of it moved with Brent.
Crude doubled. The CPI barely moved. But the petrol pump — and the airline seat — moved with it.
Two channels, one mechanism: wherever Chinese prices are set by a state formula that tracks international crude — pump prices and aviation fuel — the oil spike transmitted. Everywhere else, the price is set by policy, not by Brent.
What stayed insulated: rent, transit, utilities
Electricity — flat, and set by policy
Chinese residential electricity is tiered by usage, and the bands have not moved. Across the seven cities tracked here, tier-1 rates sit at ¥0.49–0.55 per kWh, tier-2 at ¥0.54–0.64, tier-3 at ¥0.79–0.963 — the upper bound being the highest third-tier rate in this site's seven-city set. A Beijing one-bedroom costs about ¥239 a month in utilities — electricity, water and gas, billed by usage tier. In a country where a barrel of oil went up $50, the per-kWh price did not move, because it is a regulated rate structure rather than a commodity. The visible cost of energy inflation in China is close to zero on the electricity line.
Water — the same structure, a different problem
Water across the seven tracked cities runs ¥2.40–12.94 per m³, tiered three ways, and the variation is not about energy at all. It is about how each city bills it. Beijing folds supply, resource tax and sewage into a single composite rate. Shanghai shows supply and drainage as two separate figures. Guangzhou lists water and sewage as distinct line items. Dalian applies a tiered water rate and then adds a flat separate sewage charge on top.
The practical implication: two people on the same tier can pay very different water bills purely because of billing structure. This is the largest hidden variance in Chinese utility costs, and it has nothing to do with the oil price.
Heating — the clearest case of insulation
Heating is where a $50 oil price would normally land hardest, and where Chinese cities break the pattern completely. Northern heating is centralised and billed once for the whole season — roughly six months of continuous heat paid in a single charge rather than a monthly meter, which is how Harbin describes its own billing. The charge is set administratively, not indexed to gas prices.
South of the heating line the picture inverts entirely. Jingdezhen sits south of it, has no district heating at all, and residents heat with individual air conditioning and electric heaters — a setup that is more exposed to electricity prices, and therefore more exposed to any future energy move, but also cheaper at current tariff levels.
This is the clearest illustration of the article's argument in one line: the same country, two heating regimes, neither one indexed to Brent.
Rent and metro — the lines where pressure would show up
Rent is the line where any global inflation pressure would reach a household budget, and it is where this site's 18-city data set is most useful. Beijing's city-centre one-bedroom runs ¥7,596 (about $1,055), dropping to ¥3,946 outside the centre. Chengdu runs ¥2,700 in the centre (about $374) and ¥1,500 outside it, with an all-in monthly figure of $817 — 87% below New York on a Numbeo-derived baseline.
What has not changed is the price of moving through the city. Beijing's metro starts at ¥3 for up to 6 km, rises to ¥4 for 6–12 km, ¥5 for 12–22 km, and ¥6 for 22–32 km, then adds ¥1 for every 20 km beyond 32 km. The distance-based structure introduced in December 2014 remains in place — the Beijing city page records the fare schedule as effective since that month and unchanged since, and the 2014 adjustment is what raised the starting fare to ¥3 and introduced distance banding in the first place. Across the 54 cities with metro systems, which total roughly 11,710 km of track, fares still start at ¥3.
A barrel of oil went up fifty dollars. The fare across Beijing has not moved since 2014.
The city-level split: season and latitude
The energy-mitigation story is not uniform across China, and the two variables that determine a household's exposure are latitude and season.
Northern cities with centralised heating are insulated twice over. Harbin — which swings 83°C between its coldest winter lows and warmest summer highs — bills heat once for the season, so a winter month costs the same as a shoulder month in billing terms. Its rent-to-income ratio sits at 36%, low because of population outflow rather than affordability.
Southern cities without heating pay the opposite way, per-kWh, through air conditioning. Jingdezhen is the clearest case, with no indoor heating south of the national heating line, and utility costs among the lowest in this survey.
The seasonality case is Sanya, where rent swings 2–3× between seasons. On this site's Sanya figures, a furnished city-centre one-bedroom runs about ¥2,500 in low season (May–October) and jumps to ¥6,000–8,000 in high season (December–February). This is not energy inflation, but it is the largest seasonal cost swing in the entire city set, and it collides with the energy calendar — peak domestic travel overlaps with the period when global oil is highest.
For a 2026 arrival, a household that wants to minimise exposure to a volatile global energy market has a specific answer in China. Live in a northern city with district heating, in a metro-served city, off the air-travel network. That combination costs almost nothing extra and removes the energy transmission channels this article identified — petrol at the pump, aviation fuel surcharge, and the dollar side of the currency move.
In energy terms, where you live in China matters more than what the global oil price is doing.
Who the shock barely touched
A city-level average hides more than it shows. The mechanism that matters is rent-to-income ratio, and this site tracks it across nine cities.
The two healthiest ratios are Kunming at 28% and Xi'an at 29% — cities where wages and rents align without either stagnation or subsidy distorting the number. Chengdu sits at 33% on choice: expensive for a Chinese city, cheap for the world, and the premium is bought rather than suffered. Dalian at 35% is the stagnation case, where the ratio is low because demand left. Harbin at 36% is the exodus case, lower still, on a shrinking base. Qingdao at 37% and Xiamen at 39% sit mid-spectrum.
For a 2026 arrival, an energy shock is a dollar- and euro-denominated problem. It raises the cost of living in places that import energy on those terms, and leaves places priced in local currency largely alone. For a household earning foreign currency, a yuan that strengthened about 3.2% while Brent rose 71% compounds the effect — the rent did not rise much, but each dollar bought fewer yuan to pay it with.
The practical read: the ranking of Chinese cities by affordability did not change because of the oil spike, but the cost of choosing wrongly went up. A relocating family that lands in a high-rent-ratio city on a dollar salary in September 2026 absorbed a currency move that would not have touched them in June. Working through the three budget tiers in Three Budget Tiers for Living in China with current figures is the practical version of this exercise.
The window that opened and closed
There was a stretch in late June and July 2026 when Chinese prices were at their most favourable relative to the rest of the world. Brent fell to $70.46 on 30 June, below the January–February average. China's CPI came in at 1.0% for June and 0.5% for July, the low point of the year.
For a household already holding yuan, that was an unusually good window — cheap on the world oil market, local prices flat, and a strong currency to spend in.
For a household earning dollars, it was the opposite. A stronger yuan means each dollar buys fewer renminbi. The ideal window for a foreign-income earner would have been cheap oil combined with a weaker yuan, and China did not have that combination in June. What China had in June was good for holders of yuan and mildly punishing for holders of dollars.
Then conflict resumed in July. Brent was back to $91.08 in August and $114.08 by September. Chinese CPI inflation slowed from 1.0% in June to 0.5% in July and 0.8% in August — not falling prices, but slower price growth even as oil rose.
The lesson is not a forecast. Chinese cost of living has become a currency story rather than a commodity story, and currency moves faster than anyone plans for. This is the strongest argument for budgeting against a range rather than a point.