Seven cities, rates from ¥0.49 to ¥0.66/kWh, why China's electricity stays so cheap?
Before we get to the argument, here's the number: every major Chinese city bills residential electricity in tiers, paid monthly like any utility bill — and every one of those tiers is a fraction of what a typical North American household pays.
| City | Tier 1 | Tier 2 | Tier 3 |
|---|---|---|---|
| Beijing | ¥0.49 · $0.068 | ¥0.54 · $0.075 | ¥0.79 · $0.110 |
| Shanghai | ¥0.617 · $0.086 | ¥0.667 · $0.093 | ¥0.917 · $0.127 |
| Guangzhou | ≈¥0.589 · $0.082 | ≈¥0.639 · $0.089 | ≈¥0.889 · $0.123 |
| Shenzhen | ≈¥0.663 · $0.092 | ≈¥0.713 · $0.099 | ≈¥0.963 · $0.134 |
| Chengdu | ¥0.5224 · $0.073 | ¥0.6224 · $0.086 | ¥0.8224 · $0.114 |
| Chongqing | ¥0.52 · $0.072 | ¥0.57 · $0.079 | ¥0.82 · $0.114 |
| Dalian | ¥0.50 · $0.069 | ¥0.55 · $0.076 | ¥0.80 · $0.111 |
China's residential electricity rates are 2× to 4× lower than typical US utilities, even at the most expensive tier.
Rates per kWh, residential "one household, one meter" schedules, drawn directly from each city's own published deep-dive page on this site, converted at the site's standard ¥7.2 = $1. Guangzhou and Shenzhen tiers widen further in summer (May–Oct); see each city's own page for the seasonal bands. Compare against a North American bill in §04.
Every one of these bills is paid the same way — monthly, like any utility. What differs city to city is how the tier itself gets decided: Beijing, Shanghai, Chongqing and Dalian track a household's cumulative usage against an annual allowance, so which tier applies depends on the running total for the year; Chengdu, Guangzhou and Shenzhen reset the threshold every month instead, so a single hot month can push that month's bill into a higher tier on its own. Same monthly bill, different math behind it.
Nowhere in that table is there a single "China electricity price." There are seven different schedules, and even the most expensive tier still runs less than half of what a typical American utility charges. That's not an accident of any one city's policy. It's the visible end of three separate mechanisms working together.
First, a supply history that flipped from chronic shortage to structural surplus without residential rates ever fully catching up (§01). Second, a national grid built on the back of a fast-growing clean-energy industry, generating the cheapest power in the resource-rich west and moving it a thousand-plus kilometers to the expensive east (§02). And third, a pricing mechanism that keeps household rates below actual supply cost, with businesses covering part of the difference (§03). None of the three explains the whole table alone. Add them up, though, and they're why a Beijing apartment's bill would look absurd to someone paying Con Edison in New York.
01 — A short history of the grid
From shortages to 3.89 TW capacity, how China's grid flipped to surplus?
China's total installed capacity reached 3.89 TW by end of 2025 – with renewables now making up roughly 60% of the total.
In 1949, only about three in ten Beijing households had electricity in their homes at all. Through the 1970s, a household's only real appliance was often a single ceiling bulb — by 8 or 9pm, one street after another would simply go dark.
The 1980s changed the demand side faster than the supply side could keep up. Televisions, refrigerators and washing machines started showing up in ordinary homes, electricity use climbed faster than generation capacity, and rolling blackouts became part of daily life across the country.
Beijing itself didn't reach the point of no more scheduled residential blackouts until 1993.
The reversal since then is clear in the installed-capacity numbers:
| Year | Installed capacity | Note |
|---|---|---|
| 2004 | Wind: 0.74 GW | National wind capacity, near zero |
| 2011 | Wind: 62.4 GW | 84x growth in 7 years |
| 2020 | Total: ~2.2 TW | Coal still the largest single source |
| 2025 (year-end) | Total: 3.89 TW | +16.1% YoY; renewables ≈60% of total |
1949/1993 figures reported via Chinese electricity-history retrospectives; installed-capacity figures from China's National Energy Administration, year-end 2025 disclosure.
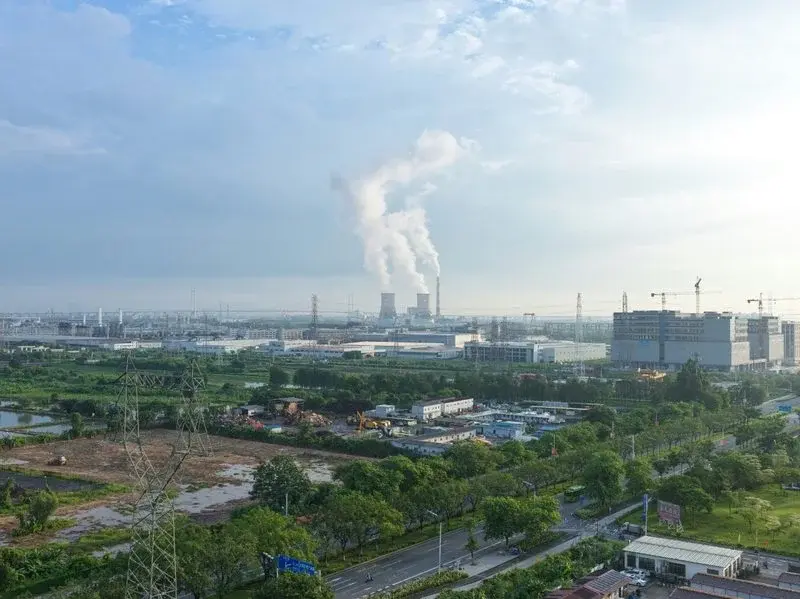
By the end of 2025, wind and solar capacity combined had, for the first time, overtaken coal-fired capacity nationally — solar alone grew 35% in a single year, wind 23%. A country that once measured its power supply in "not enough" now increasingly measures it in "where to send the surplus." That's the subject of the next section — and it's part of why cities as different as Chengdu and Dalian can each run a full tiered schedule with room to spare in the top tier.
02 — The new energy buildout
West-to-east transmission and UHV lines – moving cheap power 1,000+ km.
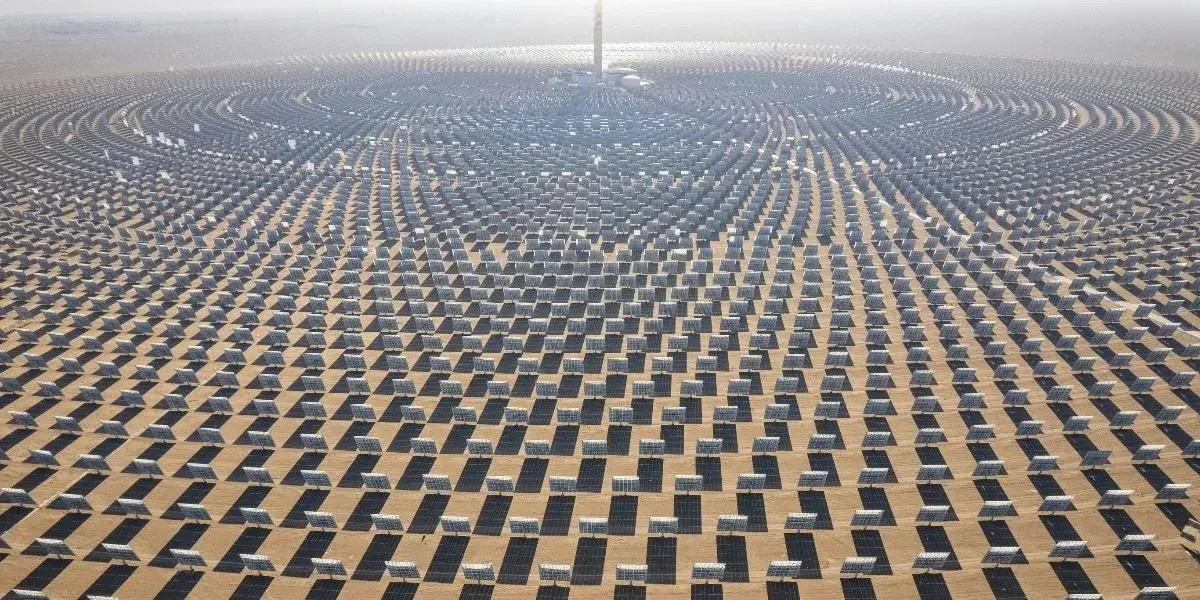
The clean-energy buildout in §01 isn't just a national total — it landed in a specific place, and that's reshaped where the country's power actually gets built. Wind and solar both need one thing coal plants don't: room. Wide open land, low population density, and steady wind or sun exposure describe China's west and north — Xinjiang, Inner Mongolia, Gansu, Ningxia, Yunnan, Guizhou — far better than they describe the crowded coastal provinces where the demand actually is. The industry grew fastest exactly where the land was available for it, on top of an older west-to-east power flow that hydropower had already established for decades. The stretch of the Yangtze around Yichang, Hubei — home to the Three Gorges Dam and other major hydro stations — has been sending power hundreds of kilometers east since the early 2000s, long before wind and solar joined it.
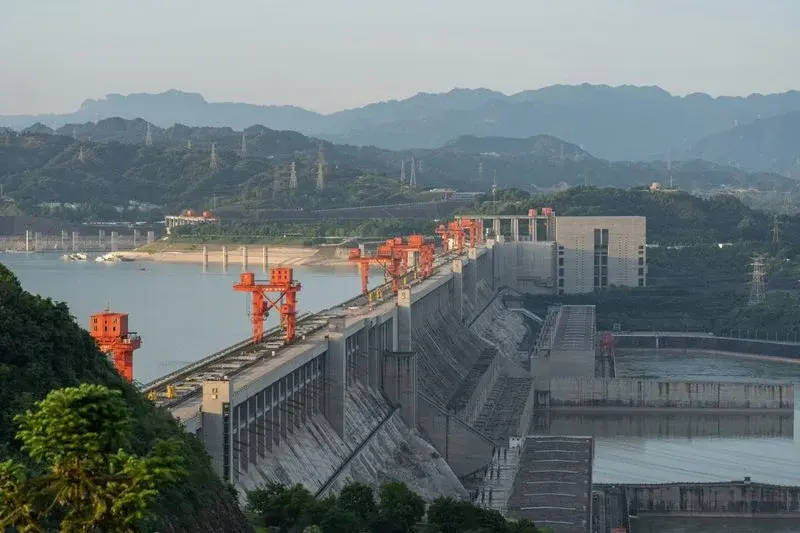
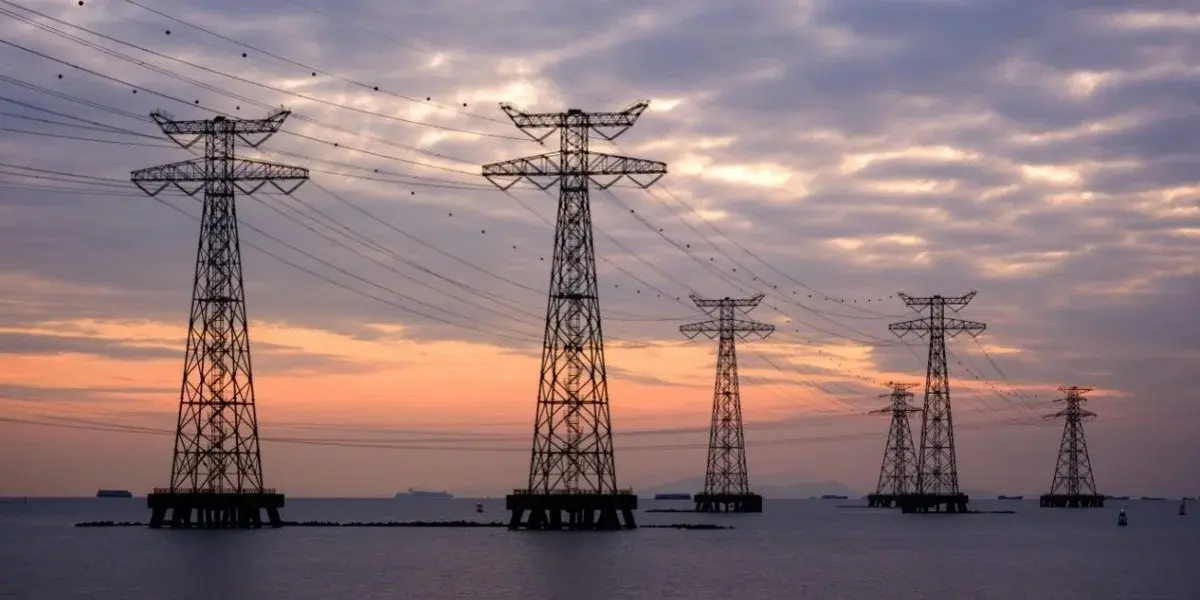
Getting new wind- and solar-generated power a thousand-plus kilometers east without losing most of it to line resistance is its own engineering problem. The fix is ultra-high-voltage (UHV) transmission — lines running at 800kV+ DC or 1,000kV+ AC, purpose-built for exactly this. They carry large transmission capacity, travel long distances, and lose far less power along the way than ordinary high-voltage lines can manage.
Without UHV, the case for building wind and solar farms a thousand kilometers from the nearest big city would be much weaker. The west-to-east grid is what makes the industry's location choice actually pay off.
| Corridor | Sends from | Sends to |
|---|---|---|
| North | Xinjiang, Inner Mongolia, Shaanxi, Ningxia | North & East China |
| Central | Sichuan, Chongqing, Hubei | Central & East China |
| South | Yunnan, Guizhou, Guangxi | South China |
The scale is genuinely large: Inner Mongolia alone, through eight UHV lines, has transmitted a cumulative 834.8 billion kWh to 11 other provinces — by one comparison, enough to cover a year's electricity use for 285 million households. Some of that power runs the same corridors this site's own high-speed rail network was built alongside — both are infrastructure moving something scarce a very long way, cheaply, on purpose.
That west-to-east price gap has started pulling something else west along with the power lines: data centers. Under the government's "East Data, West Computing" (东数西算) program, eight national computing hubs were designated specifically because western regions combine cheap, increasingly renewable power with cooler climates that cut cooling costs — four of the eight sit in the west: Guizhou, Inner Mongolia, Gansu, Ningxia.
Why electricity price decides where a server farm goes
Electricity commonly makes up over half of a data center's total operating cost — the single largest line item, ahead of hardware, staffing, or land. That makes a west-versus-east price gap the deciding factor in where a server farm gets built, not an incidental one. In Inner Mongolia's Helinger cluster, green electricity made up 86% of total power use in the first eleven months of 2025 alone.
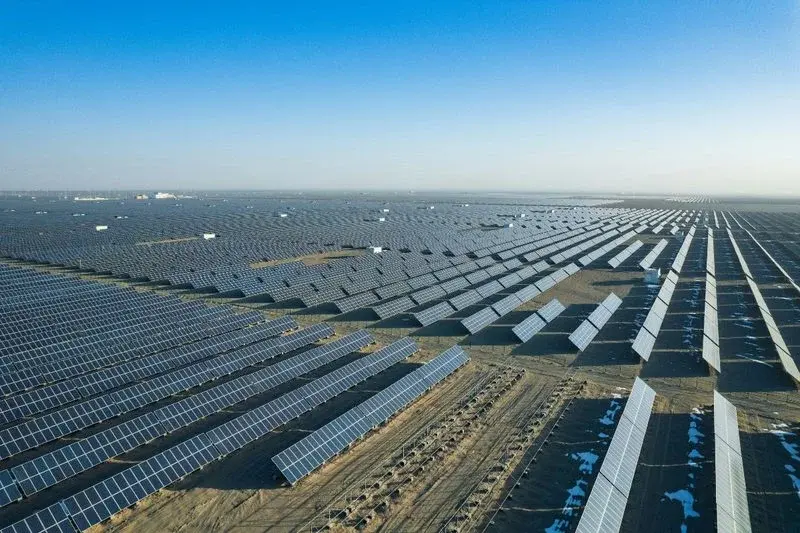
The same UHV network that moves power one direction now also lets it flow the other way at a much smaller scale. Rooftop solar on a home, a shop, or a factory can run the building on its own power and feed any surplus back into the grid for a metered credit. It's a small but growing piece of the same west-to-east system, running in miniature at the point of use rather than a thousand kilometers upstream.
That cheap rate at the meter is only possible because of the upfront capital already spent — the real cost of that infrastructure is settled elsewhere →
03 — The pricing mechanism
How the cross-subsidy works: households below cost, businesses cover the gap.
China's National Development and Reform Commission said it outright in a 2021 response to a public inquiry: residential electricity is priced well below the actual cost of supplying it, and commercial and industrial users absorb part of that difference. The commission described China's residential rates as low by international standards and its commercial/industrial rates as correspondingly high.
The mechanism has a specific origin point: a 1987 nationwide push to fund power infrastructure expansion through private and local capital. As supply costs rose with the buildout, the government held residential and agricultural rates low by design and closed the gap by raising commercial and industrial rates instead. That was a deliberate allocation, not a byproduct. It's also the reverse of what raw supply cost alone would predict. Residential users sit at the end of the grid and draw power disproportionately at peak hours — they're actually more expensive to serve than large industrial users, not less.
How large the subsidy actually is, though, is genuinely disputed — unlike the transmission figures in §02, this isn't a settled number. Industry commentary consistently describes cross-subsidy calculation as the most difficult, most contested part of China's electricity pricing system, with different research methods producing meaningfully different totals. One frequently-cited provincial-level estimate (2016) breaks down like this:
| User type | Subsidy received / paid | Effective markdown / markup |
|---|---|---|
| Residential (received) | ≈¥590 million | ≈21% below cost |
| General commercial (paid) | ≈¥2.80 billion | ≈11% above cost |
| Large industrial (paid) | ≈¥3.23 billion | ≈6% above cost |
Single-province estimate, 2016 study cited in Chinese energy-policy trade press — a representative case, not a national total; different studies produce meaningfully different figures, and no single agreed-upon nationwide total exists.
So: a real, officially acknowledged mechanism with a clear historical origin. But "how much" depends on whose calculation you're reading, and this site isn't going to invent a precise national total that the country's own energy economists haven't agreed on either. It's the same honesty-over-precision approach this site takes with a rent ledger or a five kinds of cheap framework: show the mechanism, flag the uncertainty, don't invent a clean number to fill the gap.
04 — How this compares to the West
Beijing vs. New York: a 4.4x price gap, explained.
| City / utility | Effective rate | Vs. Beijing tier 1 (¥0.49) |
|---|---|---|
| Beijing — tier 1 | ¥0.49/kWh (≈$0.068) | baseline |
| Beijing — tier 3 | ¥0.79/kWh (≈$0.110) | 1.6× |
| New York (Con Edison, all-in) | ≈$0.30/kWh | ≈4.4× |
| Austin (Austin Energy, all-in) | ≈$0.13–0.16/kWh | ≈2× |
Con Edison and Austin Energy rates computed from each utility's own published tariff, summing base charges and riders — same method used on this site's compare pages. Conversion at the site's standard ¥7.2 = $1.
Even at Beijing's most expensive tier, its electricity is still cheaper than New York's. Beijing's first tier — the one most households spend most of the year in — runs closer to a sixth of the New York rate. The honest caveat: this is a fair comparison of sticker prices, not of what sits behind them — §03's subsidy question has no clean American equivalent to net out, and the two systems' cost structures (grid maintenance, generation mix, regulatory environment) aren't otherwise comparable.
05 — Outages, then and now
3.7M households without power in 2021, what causes outages now?
What causes a blackout today looks almost nothing like what caused one in the 1980s (§01). It's no longer a supply shortfall — it's weather and accidents hitting the transmission network directly.
| Event | Cause | Impact |
|---|---|---|
| Zhengzhou, 2021 | Record rainfall (201.9mm/hr — an inland historical record) | 1,854 lines down · 3.74M households |
| Hainan, 2024 | Typhoon Yagi landfall | 836 lines down · 1.68M households |
| Forest/grassland fires | Fires trip transmission lines directly — and faulty lines can also start fires | Ongoing, seasonal risk |
The official framing today is telling in itself: the standing directive is to "hold the line against large-scale power outages and large-scale rationing" — a line to hold describes an exception to be prevented, not a condition to be managed as routine. That's the real difference between the two eras of Chinese blackouts: one was baked into the system's ordinary operation, the other is what happens when the system fails.
Add it up and the cheap number at the top of this page stops looking like a coincidence. It's a shortage-era pricing habit that never fully reset. It's the cheapest power on the grid generated a thousand kilometers from where it's used and moved there anyway. And it's a genuine, officially acknowledged policy that keeps household rates below cost.
None of that makes the number less real — a Beijing apartment's electricity bill would still look absurdly low to someone paying a Con Edison bill in New York. But 'why' is worth knowing before 'how much,' on this system as much as any other one covered on this site.
06 — Questions people actually ask
Quick answers
Why is electricity so cheap in China?
Three overlapping reasons: rates set low during a decades-long shortage never fully caught up once supply reversed; power generated cheaply in the west gets moved east over long-distance transmission lines; and residential rates sit below actual supply cost, with commercial/industrial users covering part of the gap.
Do all Chinese cities pay the same electricity rate?
No — every city bills electricity monthly, but each sets its own tiered residential rate schedule, and cities differ in whether the tier is decided by annual cumulative usage (Beijing, Shanghai, Chongqing, Dalian) or by usage reset every month (Chengdu, Guangzhou, Shenzhen, with wider summer tiers). First-tier rates across these seven cities range from about ¥0.49 to ¥0.66 per kWh.
Is it true that businesses subsidize household electricity in China?
China's National Development and Reform Commission has stated directly that residential electricity is priced below the cost of supplying it, with commercial and industrial users absorbing part of the gap — though independent estimates of exactly how large that cross-subsidy is vary significantly.
Why are data centers being built in western China?
Electricity is typically the single largest cost of running a data center, and China's western provinces combine some of the country's cheapest, increasingly renewable power with cooler climates — which is why the "East Data, West Computing" program designated hubs in Guizhou, Inner Mongolia, Gansu and Ningxia specifically.
Do Chinese households still experience regular power outages?
Not for supply-shortage reasons — routine, scheduled blackouts are largely a thing of the past in urban China. Today's outages are almost always tied to extreme weather or accidents damaging transmission infrastructure, not a shortage of power itself.