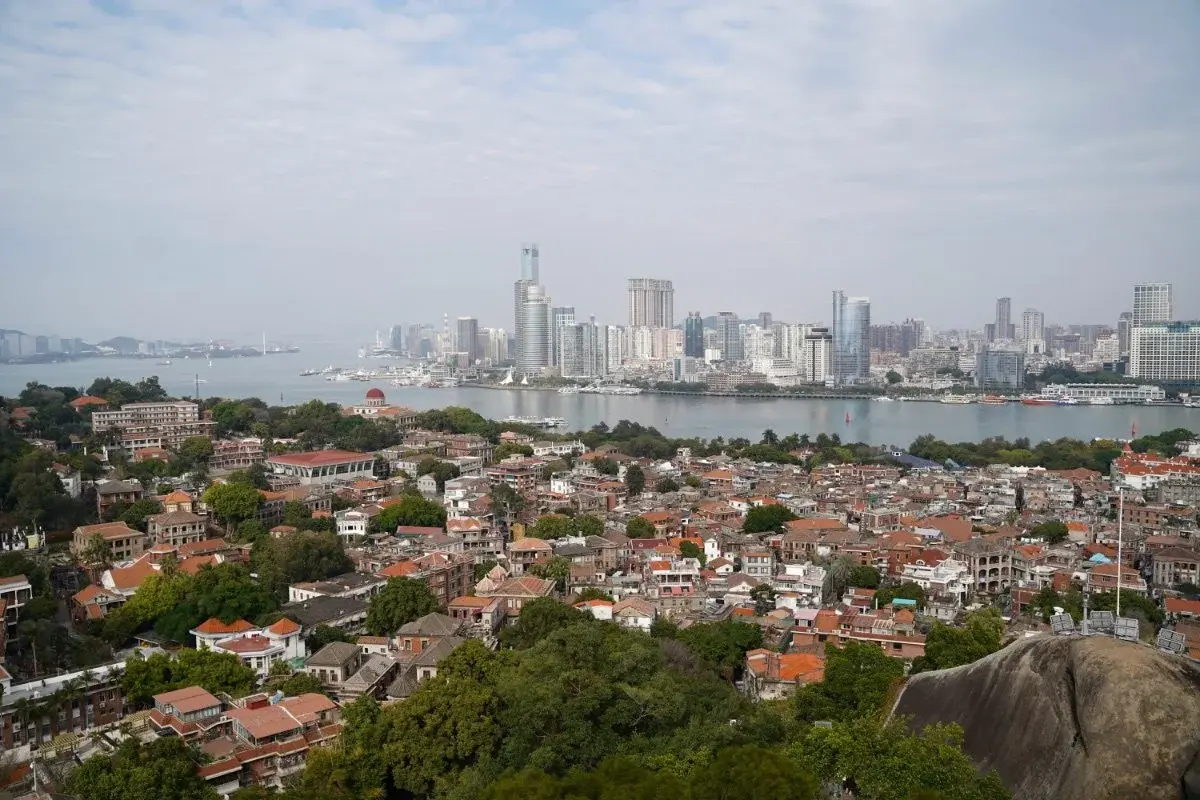

Both cities sell the same postcard: a warm island, a photogenic waterfront, a slower pace than the mainland. Both cities have spent decades building that image on purpose, and both have watched property prices climb well past what the local job market actually supports. Xiamen calls it a garden city. Honolulu calls it paradise. The mechanism underneath is the same word either way: a tax on beauty, paid by whoever's trying to live there rather than just visit.
What doesn't match is the currency, and — as this page tries to show honestly — how much of the price gap survives once you account for what each city actually pays its own residents.
 Xiamen
 Honolulu
Two waterfront streets, two versions of the same resort-city density. Photos by Leoon Liang and Victor De Santiago.
01 — Side by side
Xiamen vs Honolulu: same brand, priced on two different oceans.
Xiamen vs Honolulu: $396 vs $2,913 rent (7.4× gap), $1,064 vs $4,125 net salary (3.9× gap). Xiamen's rent advantage outpaces its salary gap, but both cities' own residents still feel squeezed. All figures are typical 2026 costs for one person, in US dollars. Xiamen's yuan amounts are converted at roughly ¥7.2 to $1.
Xiamen: island (Siming/Huli)≈$396$2,9137.4×
Xiamen: mainland districts≈$208$1,9499.4×
Xiamen ranged; Honolulu derived, see note≈$646≈$3,943Derived6.1×
Xiamen ranged; Honolulu derived, see note≈$375≈$2,863Derived7.6×
Buying rather than renting is a different question. Honolulu runs roughly $822 per square foot in the city center by Numbeo's own crowd-sourced figure. We don't have a comparably confident Xiamen buy-price figure to set against it, so we're not building that comparison here; it's flagged as an open gap, not a number we're guessing at.
Look at the "gap" column and it still doesn't fully line up: rent runs 6–9× cheaper in Xiamen, but net salary only runs about 3.9× apart. That's now a clean, same-methodology comparison on both sides, and the gap between the two multiples is the real story: Xiamen's rent advantage outpaces its salary disadvantage, meaning the city's affordability edge holds even adjusted for what each side actually pays. §04 digs into why that's worth a second look rather than taking at face value. If you want to run this against your own salary instead of the average, the move calculator does that math directly.
But remember: the city is only one variable in your monthly spend. The same city, different lifestyle. The bill gap can be even larger →
02 — The everyday layer
Xiamen vs Honolulu: what rent, utilities, and groceries actually cost?
Rent runs 6–9× apart. The utilities, groceries, and getting-around costs sitting underneath it don't all move at the same rate — and in Xiamen's case, one of them we can't confidently report at all.
Utilities: an honest gap in the data, not just the price
This site's own Xiamen deep-dive flags electricity, water, and gas rates as not confirmed — the published schedules we found conflicted or were stale, and rather than guess, we left that table empty there. The same caution applies here: we're not going to manufacture a Xiamen number just to fill this row.
915 sq ft apartment equivalentNot confirmed≈$255:
This site's general China-carrier estimate$72.53
Numbeo, 10GB+ data≈10–18×
This site's general China-provider estimate$65.78
Numbeo, 60Mbps+≈3–5×
Why both cities have a "which side of the water" question
Hawaiian Electric's own reporting attributes the state's sky-high power rates to the same root cause as Xiamen's rent split in this site's Xiamen deep-dive: almost everything has to be shipped or generated locally on a land-constrained island, and there's no cheaper mainland grid to fall back on. Xiamen at least has bridges to mainland districts with lower costs across the board; Honolulu's entire city sits on the expensive side of that equation, full stop. There's no "outside center" district on Oahu that isn't still an island.
Utilities are one place the comparison structurally breaks down. Groceries are more directly comparable.
Groceries: the everyday basket
Xiamen's figures below are this site's own regional retail estimates, already flagged on the Xiamen deep-dive as not a confirmed municipal monitor. Honolulu's are Numbeo's crowd-sourced city data.
Converted from ≈¥13/500g$9.17/lb*
*Not pork — chicken fillet shown instead5.6×
Converted from ≈¥6/500g at ≈60g/egg$9.04
Numbeo — Honolulu is the world's #1 most expensive city for bread; eggs run similarly high8.3×
Mixed retail basket average$2.22/lb
Potatoes specifically, not a basket match5.0×
The restaurant-meal gap (≈9×) runs wider than the grocery gaps (5–8×) — a pattern that shows up on several of this site's comparisons: eating out concentrates a bigger share of the cost difference than cooking at home does, since labor and rent both feed into a restaurant bill and both run expensive in Honolulu specifically.
 Xiamen
 Honolulu
A street snack vs. a single bakery pastry — the price tag on the Honolulu side is the whole restaurant-gap argument in one photo. Photos by Hailey Tong and Smallbox.
Food is what you buy standing still. The last piece of the everyday layer is what it costs to move.
Getting around
At heart, both cities are building rail systems to solve an island-geography problem. Xiamen's to connect the built-out island core to its mainland districts, Honolulu's to connect a car-dependent, traffic-choked south shore. Neither system is finished.
Metro; 3 more lines under construction13 stations open, 16.1 mi
Skyline; 19 stations/18.9 mi planned, full completion 2031—
Distance-based, see this site's Xiamen page$3 flat
Same fare on TheBus, free transfers—
Pay-per-ride; e-Tong card gets 10% off$80
Also the daily fare cap × ~10.7 days:
Both systems are automated, driverless, and were each, in their own way, the largest infrastructure project their region has undertaken. Skyline is explicitly described as the largest public-works project in Hawaii's history. Xiamen's system is already several times the size Honolulu's is planned to reach even once finished.
03 — The latte test
Xiamen vs Honolulu: the latte test — $3.89 vs $9.36.
All of that is still table data. Here's the same gap in a single, tasteable object: a coffee, bought with a water view, in each city.
A 2.4× difference: the narrowest gap on this entire page, and worth noting precisely because it's narrow: coffee culture is a genuinely global, competitively priced category in a way rent, eggs, and restaurant meals aren't. It's the one line item where "island paradise" isn't buying nearly as much of a premium.
04 — The honest part
Xiamen vs Honolulu: is the 7.4× rent gap actually that big?
The coffee gap was the narrowest number on this page. The wage question is where the rest of the numbers either hold up or fall apart, and here's where this comparison gets more interesting than most "X is so cheap!" pieces. Usually, the honest correction is that the rent gap and the wage gap track each other closely: cheap city, cheap wages, same relative squeeze for the people who actually live there. That's the pattern on this site's Dalian vs Seattle page, where both multiples land around 6×.
That's not what happens here. Rent runs 6–9× cheaper in Xiamen. Net salary — now Numbeo's own figure on both sides, the same field and vintage used everywhere else on this site — only runs about 3.9× apart. That's not a mismatched-methodology artifact anymore; it's the actual pattern. On a rent-to-income basis, Xiamen comes out ahead of Honolulu even adjusted for what each city actually pays its residents.
Why that doesn't settle the local affordability question
A clean international comparison isn't the same thing as a clean local one. This site's own Xiamen deep-dive documents, at length, that Xiamen's rent-to-income ratio has repeatedly ranked among the worst in China: measured there against official local wage statistics, not against Numbeo's crowd-sourced net-salary figure used on this page. Those are two different, both-legitimate ways of asking "can people afford to live here," answering two different questions: one compares Xiamen to Honolulu, the other compares Xiamen to itself.
Both things can be true: Xiamen comes out ahead of Honolulu on this page's rent-to-income basis, and Xiamen's own residents are among the more rent-burdened in China relative to what the local economy actually pays them. The honest version holds both, rather than picking whichever one makes a cleaner headline.
Neither city is cheap for the people who live there. One of them is just less expensive to be priced out of.
 Xiamen
 Honolulu
Each skyline built to be seen from the water, not to be affordable to live behind. Photos by Dongsh and Leopold Maitre.
For a North American or anyone paid outside either local economy, the practical takeaway is simpler: both cities offer a strikingly similar "beautiful, tourist-branded island life" experience, and Xiamen delivers it at a steeper discount — even before you get into the currency-conversion arithmetic that makes remote-paid living in China generally cheaper than in the US.
05 — Who each city is really for
Xiamen vs Honolulu: who each city is actually for.
None of the math above boils down to a single winner — it resolves into two different answers depending on whose paycheck is paying the bill.
Xiamen makes sense if…
You earn outside China and want a genuinely beautiful, mild-winter coastal base without US or Hawaii-scale housing costs — and you're comfortable navigating the island/mainland rent split to find the version of the city that fits your budget.
Honolulu makes sense if…
Family, a US-based career, or citizenship ties keep you there, or the specific combination of US legal/medical infrastructure and island life is worth a steep premium you're prepared to budget for.
Neither city is "winning" for the people whose wages are actually set there — both governments now run subsidized-housing programs because the market rate priced out working residents. The gap only becomes a genuine advantage for someone who can choose which side of either ocean their paycheck comes from.
06 — Questions people actually ask
Quick answers
How much cheaper is Xiamen than Honolulu?
A one-bedroom on Xiamen island runs about $396/month vs $2,913 in Honolulu's city center, a 7.4x gap. Off-island in Xiamen it's about $208 vs Honolulu's $1,949 outside downtown, a 9.4x gap.
What do Xiamen and Honolulu have in common?
Both are island cities that built their economies on tourism and a romantic, photogenic brand, and both now have local governments funding subsidized housing because that brand priced out the people who actually live there.
Is Xiamen actually cheaper relative to local wages, or just cheaper in dollars?
Both. Xiamen's rent runs 7–9x cheaper than Honolulu's, while net salary — now compared using the same Numbeo methodology on both sides — runs about 3.9x apart, meaning Xiamen's affordability edge holds even adjusted for local pay. That's a separate question from whether Xiamen's own residents can comfortably afford Xiamen, where local rent-to-income reporting tells a tighter story.
How does public transit compare between Xiamen and Honolulu?
Xiamen Metro runs 3 lines, 98.4km and 77 stations, with distance-based fares from ¥2 to ¥9. Honolulu's Skyline rail has 13 stations open over 16.1 miles (out of a planned 19 stations, 18.9 miles), with a flat $3 fare and an $80 monthly cap.
Why do both cities have island/mainland or urban/suburban cost splits?
Xiamen's island core (Siming and Huli) is fully built out with no land left, pushing new development and lower rent onto the mainland districts across the water. Honolulu faces the same land-scarcity math on Oahu itself — only a small share of the island is zoned for housing, which is the direct driver of both cities' rent premiums.