
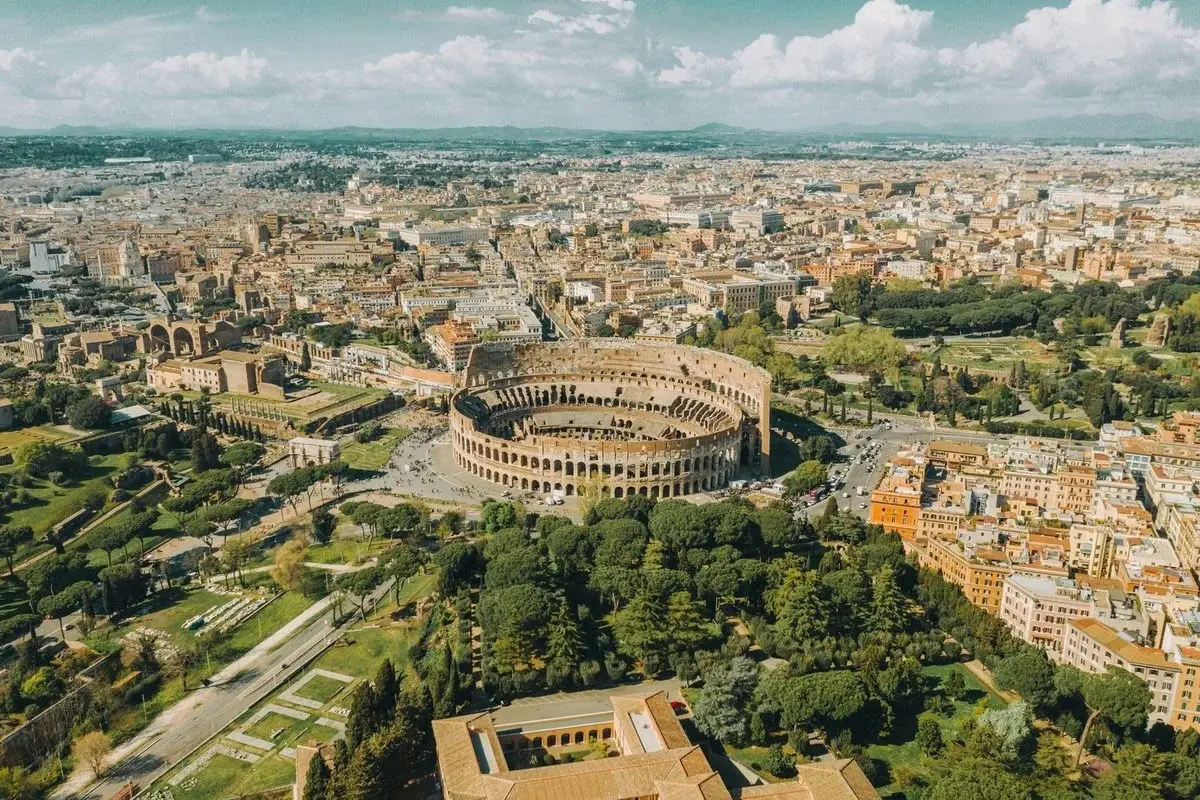
Most comparisons in this series pair a Chinese city with an American one, and there's always something slightly forced about it — Dalian and Seattle share a coastline, Chengdu and Austin share a vibe. Xi'an's twin isn't in America, and it isn't the only one in this series that goes looking elsewhere — Qingdao's own comparison crosses into Canada for the same reason. Xi'an's pair, though, is the city at the other end of the actual road.
For a few centuries around the height of the Han and Roman empires, the two largest, richest cities on Earth were connected by one caravan route. Silk left Chang'an; silver left Rome; each capital was a rumor in the other. Both cities have since been demoted by history in almost exactly the same way — the money moved to the coasts and the north, the emperors became tourist material, and the ground beneath both became so dense with the past that modern construction is a form of excavation.
 Xi'an
Xi'an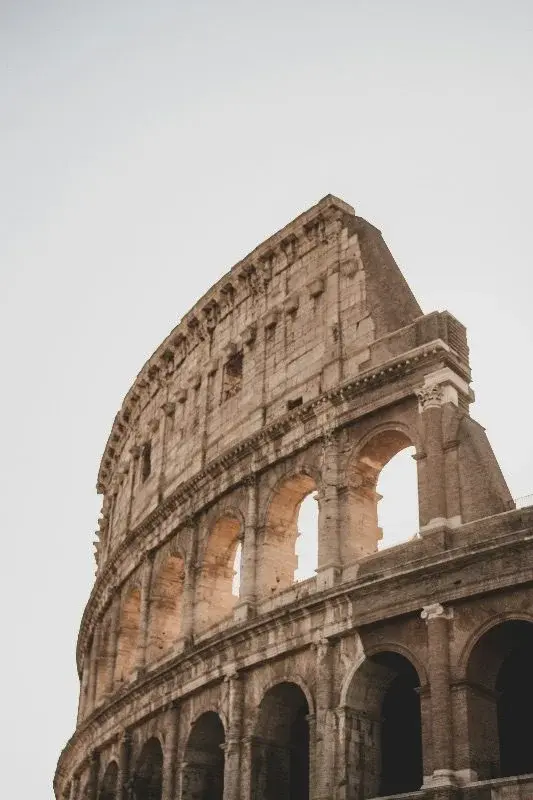 Rome
RomeThat last part isn't a metaphor. Both cities have spent the last two decades learning what it costs to build a metro through an empire. We'll get to that — it's the best part. Numbers first.
01 — Side by side
Xi'an vs Rome: the same life, priced twice ($311 vs $1,261 rent).
Xi'an vs Rome: $311 vs $1,261 rent (4.1× gap), 29% vs 63% of wages. One ancient capital is affordable for locals; the other isn't — and that's before you dig a subway. Typical 2026 costs for one person, in US dollars. Xi'an's yuan figures are converted at roughly ¥7.2 to $1; Rome's euro figures at roughly €1 = $1.14.
Rome runs three to four times Xi'an's costs on most lines. In the American pairings, a gap like that was usually an illusion — the salary gap matched the cost gap, and everything canceled. So look at the last row.
The full rent picture, standardized to the North American 1-bed/2-bed convention
But remember: the city is only one variable in your monthly spend. The same city, different lifestyle — the bill gap can be even larger →
02 — The honest part
Xi'an vs Rome: 29% vs 63% of wages — this time it doesn't cancel.
Rome's costs are roughly 3–4× Xi'an's. Rome's take-home pay is only 1.8× Xi'an's. In every US comparison in this series, the multiples roughly offset — a barista faced the same rent arithmetic in Chengdu as in Austin. Between the two ends of the Silk Road, they don't offset. Run the ratio that actually matters to someone earning and spending in the same city:
A renter on a local salary hands their landlord about twice the share of a paycheck in Rome that they would in Xi'an. This is the first pairing in this series where the cheap city is also, by a wide margin, the more affordable one for locals. The ancient capital that's still cheap turns out to be the one that can afford itself — and it isn't the one with the euro. If you're weighing an actual move between cities like these, the move calculator runs this same math against your own salary instead of the average.
Rent is the headline, but it isn't the whole monthly bill. Before the archaeology — the actual reason these two cities share a page — here's everything else the meter, the market, and the phone plan add on top of it.
03 — The everyday layer
Xi'an vs Rome: utilities, groceries, and a night out.
Neither city's meter or market stall gets the attention its metro archaeology does. It should — this is where a monthly budget actually gets spent.
Utilities
Xi'an's electricity and gas are tiered and billed annually. Rome's utilities are typically one bundled monthly estimate rather than itemized per-unit rates — a real difference in how the two systems hand a renter their bill.
Groceries
Same items, two very different retail systems — Xi'an's from a provincial price monitor, Rome's from Numbeo's own crowd-sourced grocery data.
Rome runs 2–4× more across every grocery line here — the narrowest multiple in the set (beef) is still double, and eggs are the widest gap in this whole everyday-layer section. Nothing in the weekly shopping bag closes the gap the way mobile plans nearly do.
Dining out and staying connected
The last everyday-layer numbers: what a night out costs, and what the phone and broadband bill looks like either way. (For what actually signing up for a Chinese mobile/broadband plan involves, see how getting connected works.)
 Xi'an
Xi'an Rome
RomeDining and telecom run 2–6× more in Rome — a narrower gap than rent's 4–5×. It's the one place in this whole comparison where Rome's premium actually starts closing rather than widening. Mobile plans in particular are the closest the two cities get anywhere on this page. None of that, though, is why these two cities actually belong on the same page.
04 — The subway test
Xi'an vs Rome: the subway test — try digging in either city.
A metro is the most honest archaeological instrument a city can own: it doesn't care what's down there, it just has to get through it. Point that instrument at Rome and at Xi'an and you get the same result — an empire answers — followed by two very different responses.
Xi'an · the network
- An archaeological survey precedes every line; the heritage bureau is involved in every metro project, from route planning on.
- Line 2 took five years — long by Chinese standards — and turned up some 260 tombs and 3,000+ artifacts along the way.
- Line 8, a single loop line, produced 1,356 ancient tombs during 2020–21 excavations.
- Line 5 struck Feiqiu — the ruins of a 2,000-year-old capital — and planners weighed re-routing the line around it.
- Xianyang West station displays Qin- and Han-dynasty bricks in situ; the airport's new terminal opened with an in-terminal archaeology museum. Yes, really.
Rome · Line C
- Archaeological investigations began 2006; the line has been in the works for two decades and counting.
- A planned downtown station at Largo di Torre Argentina was cancelled outright — the ruins were more extensive than expected. The ruins won.
- The Colosseo station finally opened in December 2025, with museum-style displays of what the digging found.
- Piazza Venezia station: preliminary digs hit Hadrian's Athenaeum in 2009. Cost: ≈€700 million — five to seven times a normal station. Trains will arrive 48 meters down, around 2033.
- Full line: ≈€7 billion, complete around 2035. Roughly thirty years, end to end.
Note what's identical and what isn't. Identical: the ground. Both cities discovered that the tunnels themselves are easy — you bore them deep below the past — and that the stations are the problem, because stairs and vents must reach the surface, and between the platform and the sky lies everything that ever happened. Identical, too, is the punchline: both cities gave up fighting it and started building the museum into the station.
Rome slowed down for the dead — a generation per station. Xi'an hired the archaeologists by the thousand and kept digging. Both ended up displaying the empire next to the turnstiles.
The difference is tempo, and it's a fair snapshot of the two systems. Italian heritage law requires full excavation and preservation when something significant surfaces. In the center of Rome, something significant always surfaces. The result is the slowest, most expensive, most lovingly documented subway in Europe. Xi'an runs salvage archaeology as a scheduled industrial process — survey first, dig fast, record, build. That's how a city sitting on thirteen dynasties' worth of tombs still managed to open a whole metro network in the time Rome spent on one line. Neither approach is free. One pays in decades; the other pays in the brutal arithmetic of speed.
 Xi'an
Xi'an Rome
RomeThe archaeology explains why these two cities belong on the same page. It doesn't explain away that 63% from earlier — so before moving on, it's worth returning to it directly.
05 — The honest brake
Xi'an vs Rome: what the 63% rent-to-wage ratio doesn't tell you.
Before this reads as "Xi'an wins," slow down. That Roman ratio describes a specific person: a renter, on a local wage, entering today's market. Most Romans are not that person.
The number that softens the number
≈75%The share of Italians who live in owner-occupied homes — among the highest rates in Western Europe. Italian housing passes through families: bought decades ago, inherited, often mortgage-free. The brutal rent math describes newcomers, the young, and the mobile — which is precisely why so many young Italians leave. The city is affordable to those who inherited it.
And the euro paycheck buys things no ratio captures: EU healthcare, an EU passport's freedom of movement, and a currency that travels. China's urban homeownership rate is also among the world's highest, so the caveat cuts both ways — rent ratios describe cities as experienced by outsiders and the young. That's exactly who this site writes for, which is why we lead with them. But don't mistake the renter's city for the whole city.
The buy-side numbers make the same point a different way. A Xi'an buyer and a Rome buyer aren't shopping in the same kind of market at all:
Buying tells almost the same story as renting, just slightly gentler. Center-to-center, Rome costs nearly four times more to buy into than Xi'an — about the same gap as rent. That's the flip side of the 75% homeownership figure above. Roman housing wealth is concentrated in whoever already owns, inherited, or bought decades ago. A renter entering today's market would find that price considerably harder to match on a local salary.
06 — Where the analogy breaks
Xi'an vs Rome: where the Silk Road analogy breaks down.
Two ends of one road, two unexcavatable downtowns — the symmetry is real, and it is also not the whole picture.
Four places this comparison fails
- Scale. Xi'an has about 13 million people; Rome's city proper has under three million. One is China's eighth-largest city absorbing semiconductor fabs; the other is a mid-sized European capital by headcount. These are different kinds of object.
- The address of the empire. Rome's antiquity is above ground — on postcards, in traffic circles, priced into every hotel room. Xi'an's is underground and 99% unexcavated. Rome monetizes visibility; Xi'an monetizes mystery. Two entirely different tourism products that happen to share a business model: the dead.
- Direction of travel. Xi'an's low costs are a stage of ascent — a rising inland city whose wages and supply chains are still arriving. Rome's high costs are a stage of maturity — a slow-growth economy whose economic center of gravity long ago moved north to Milan. Same snapshot, opposite trajectories.
- Systems. Euro vs. yuan, EU labor mobility vs. hukou registration, Italian property law vs. Chinese land leases, and one of them is still its country's political capital. No single narrative arc spans both, and anyone selling you one is selling something.
 Xi'an
Xi'an Rome
Rome07 — One more thing the road carried
Xi'an vs Rome: noodles and pasta — wheat at both ends.
The old story — that Marco Polo carried noodles home from China and Italy learned pasta from the East — is almost certainly false; Italy had pasta before he ever left. The truth is better than the legend: two wheat civilizations, at the two ends of one road, independently decided that the best thing to do with flour is to pull it into strings and argue about the sauce forever after. Xi'an's biangbiang and youpo noodles are hand-pulled, chili-scalded, built for the dry north; Rome's canon runs through amatriciana, carbonara, cacio e pepe. Neither city treats its noodles as cuisine. Both treat them as identity — which is why, in both places, the surest way to start a fight is to suggest the other neighborhood's version is better.
 Xi'an-style
 Rome-style
08 — Who each city is really for
Xi'an vs Rome: who each city is actually for.
Xi'an makes sense if…
You earn in dollars or euros and want a vast, cheap, history-saturated base where the local economy actually works — rent at 29% of the average local wage, noodles at street prices, and the world's most famous unopened tomb half an hour away.
Rome makes sense if…
You're buying Europe: the passport zone, the healthcare, the ruins in the open air, the fourth espresso. Just know the local wage math is brutal for renters — plan to arrive with outside income or a very good contract.
Two thousand years ago these cities anchored the two ends of the same road, each convinced it was the center of the world. Both were right, and then both were wrong, and the road itself moved to the sea. What's left is two cities that can't build a train station without meeting their former selves — one of them charging you €1,106 for the privilege of living upstairs from the empire, the other charging ¥2,240. For once in this series, cheap and affordable are the same city.
09 — Questions people actually ask
Quick answers
How much cheaper is Xi'an than Rome?
A city-center one-bedroom runs $311/month in Xi'an vs approximately $1,261 in Rome — about 4.1x apart. All-in monthly cost for one person is $585–777 vs roughly $2,240–2,900.
What do Xi'an and Rome have in common historically?
Both were the two ends of the Silk Road, and both are cities where building a subway means excavating an actual empire buried underneath.
How does average take-home pay compare between Xi'an and Rome?
About $1,089/month in Xi'an vs roughly $2,009 in Rome — a gap of about 1.8x, smaller than the roughly 4x gap in rent.
What does a monthly transit pass cost in each city?
About $24 in Xi'an vs approximately $40 in Rome.
Is Xi'an definitively cheaper than Rome once wages are accounted for?
Not entirely — the comparison's own honest-brake section addresses specifically what a headline ratio like 63% doesn't tell you about the real picture.