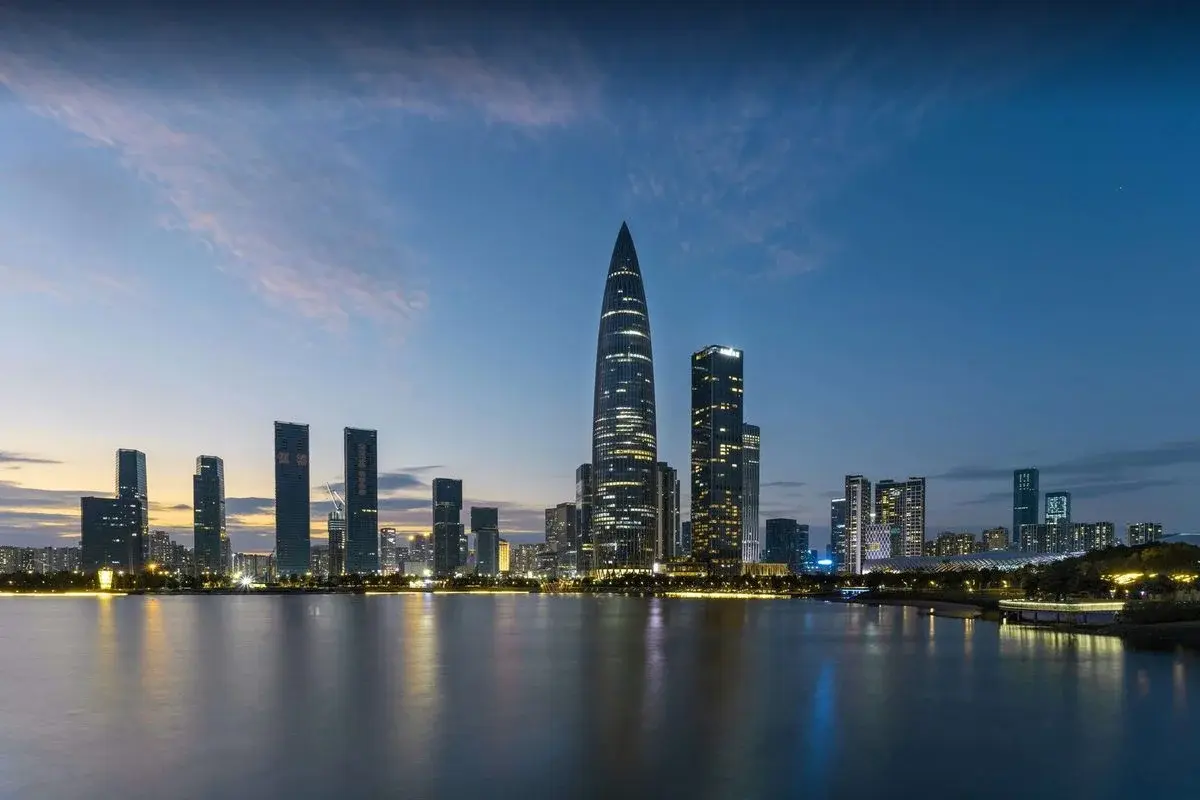
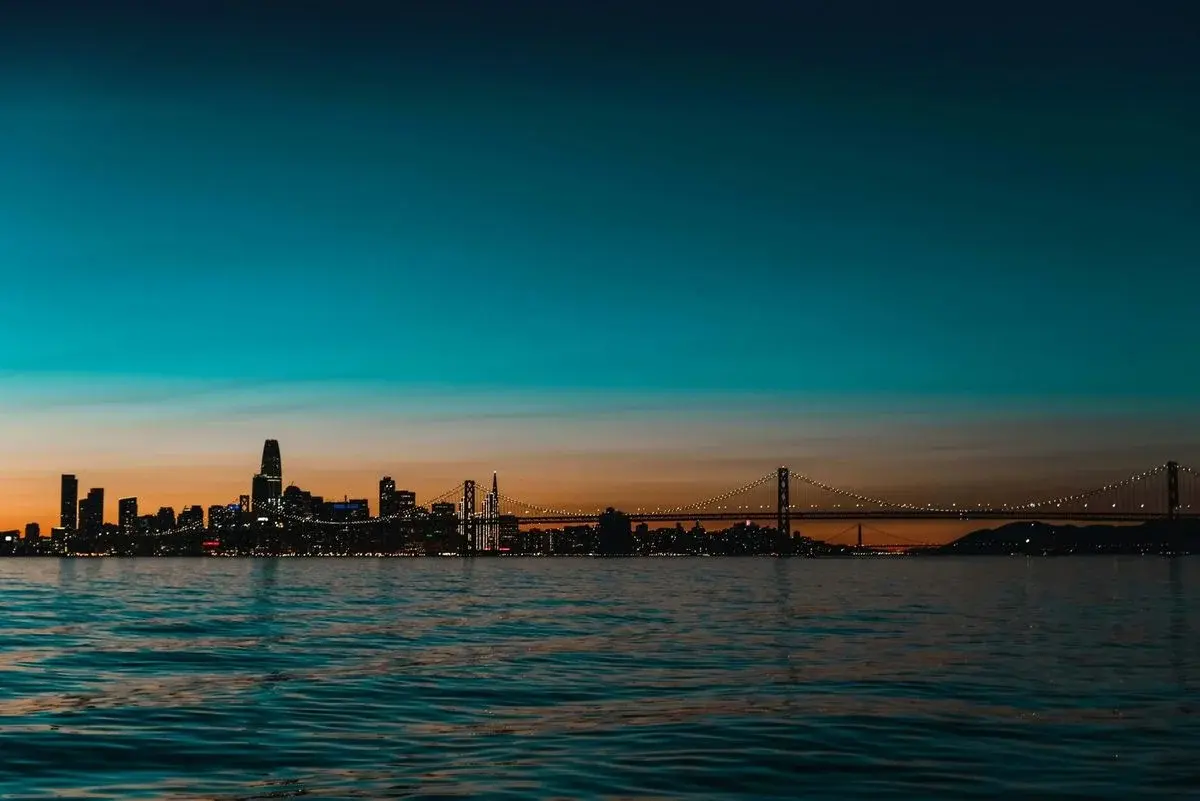
The Shenzhen deep-dive ended on a line that fits San Francisco just as well: a city's affordability is a phase, not a property. Put the two next to each other and you get the cleanest test this series has run of that idea — because Shenzhen and San Francisco are the same kind of place, a tech capital that made a fortune and made itself unlivable, getting there from opposite ends.
Shenzhen is the youngest big city in China — average age 32.5, still pulling in people by the hundreds of thousands. San Francisco is older and richer per head. The twist: it lost residents sharply after 2020 — down from about 874,000 to roughly 813,000 by 2022. The count has been slowly climbing back since, to about 826,000 as of 2025. But it's still below its pre-2020 peak, and it remains one of the most expensive cities on earth. So this is not a story about which city is dearer. It's about who each one quietly leaves out.
 Shenzhen
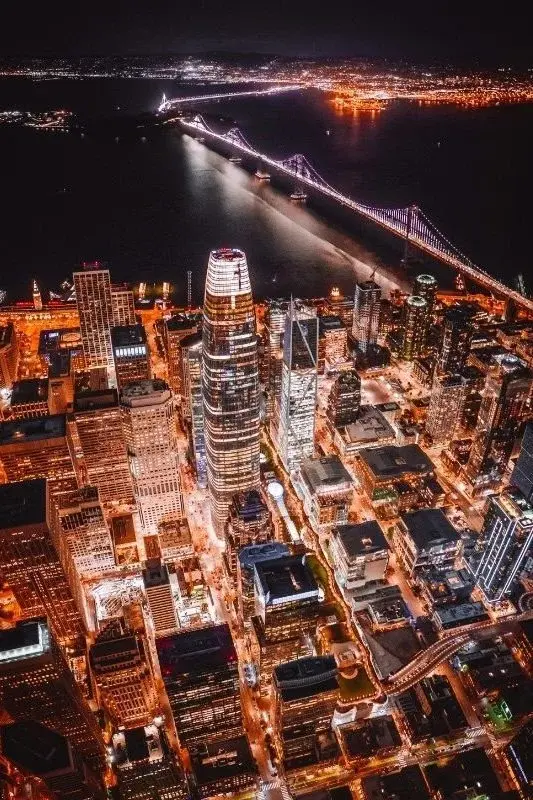 San Francisco
01 — Why set these two against each other
Shenzhen vs San Francisco: two tech engines, one question.
Each is its nation's tech capital. Shenzhen's Nanshan district packs Huawei, Tencent, DJI and a hundred-plus listed companies into a few square kilometers. San Francisco anchors the corridor that runs from Salesforce through the venture money to the current AI boom. In both, the same machine ran: high-paying work pulled talent in, and the price of a home climbed faster than the paychecks chasing it.
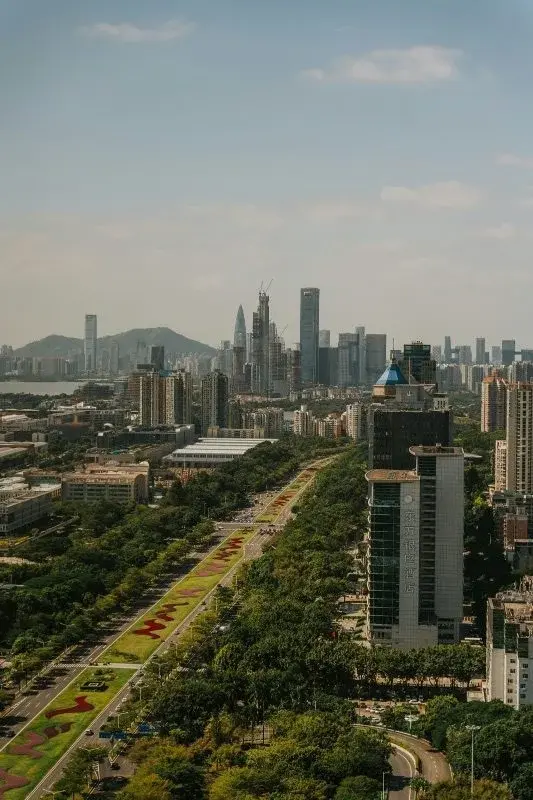 Shenzhen
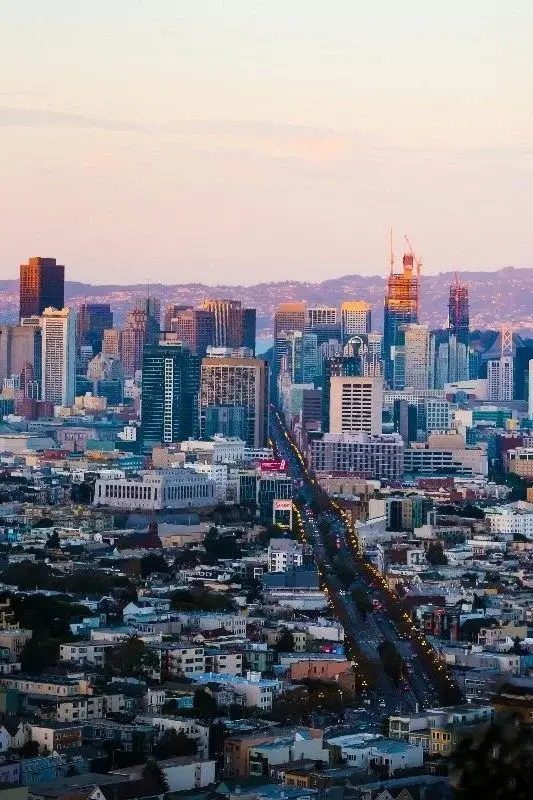 San Francisco
The resemblance is real, and it stops exactly where it matters. Both cities priced out the people who build them — but Shenzhen does it to a population that is still arriving, and San Francisco to one that is heading for the exits. (Shenzhen is one of three cities on this site that breaks the "cheap" pattern outright — see Five Kinds of Cheap for how it fits alongside the other four.)
02 — The numbers, side by side
Shenzhen vs San Francisco: 35× vs 10× price-to-income.
Shenzhen's city-center one-bedroom runs $720 a month. San Francisco's runs $3,500. In dollars, San Francisco wins easily. In local wages, Shenzhen is the harder city — home price ÷ local income: 35× vs 10×. Read the table twice. The first read is obvious. The second is the one that matters.
| Monthly / one person | Shenzhen | San Francisco |
|---|---|---|
| Rent, 1-bed, city centre | ≈$720 | ≈$3,500 |
| Rent, 1-bed, outside centre | ≈$389 | ≈$2,600* |
| Rent, 2-bed, city centre Shenzhen: midpoint estimate | ≈$1,225 | ≈$4,900* |
| Rent, 2-bed, outside centre Shenzhen: midpoint estimate | ≈$672 | ≈$3,600* |
| All-in (rent + living) | ≈$1,280 | ≈$5,000 |
| Median home | ≈$500K† | ≈$1.7M |
| Income needed to buy at the 10× ratio below | — | ≈$170K/yr |
| Home price ÷ local income | ≈35× | ≈10× |
*San Francisco's 1-bed city-centre figure and all-in cost are directly sourced (Numbeo/Wise, mid-2026). The 1-bed outside-centre and both 2-bed rows are this site's own derived estimate — San Francisco's own typical center-to-outside-centre and 1-bed-to-2-bed spreads, applied to the directly-sourced center figure — not independently tracked numbers; treat them as directional. †A modest ~70㎡ flat at ≈¥52,000/㎡ (≈¥3.6M). Rents and single-person costs: Numbeo and Wise; Shenzhen resale prices: Anjuke; San Francisco home price: Redfin — all mid-2026, ≈¥7.2 = $1. Price-to-income ratios are indicative, from the standard trackers.
There it is. San Francisco's homes cost more than triple Shenzhen's in absolute dollars. But relative to what people earn locally, Shenzhen sits near the very top of the world's price-to-income rankings — well above San Francisco. If you're paid in dollars, Shenzhen is dramatically cheaper. If you have to earn the local wage and buy a local home, Shenzhen is the more impossible of the two.
But remember: the city is only one variable in your monthly spend. The same city, different lifestyle — the bill gap can be even larger →
Worth flagging directly: Shenzhen's own median take-home (≈$900/mo) doesn't clear this page's Shenzhen all-in estimate (≈$1,270–1,290, see the summary bar above) — the median worker's whole paycheck doesn't cover a market one-bedroom plus an ordinary life, which is exactly why the deep-dive's own ledger has them renting a room, not an apartment. San Francisco's representative take-home (≈$6,900/mo) comfortably clears its own all-in estimate — its affordability problem isn't the everyday cost of living, it's the $170K/yr threshold to buy, which sits well above what most residents actually earn. Run your own numbers against either city's real figures rather than the median.
03 — The divergence
Shenzhen vs San Francisco: one fills with young, the other lost residents.
This is the real subject — the place where two cities that look alike on a spreadsheet turn out to be opposites. The question they share — who gets to stay? — each answers in a mirror image of the other.
Shenzhen
Average age 32.5, still pulling in hundreds of thousands a year. The exclusion isn't at the door — it's the rent you can never turn into a mortgage, and the 35th birthday the tech industry treats as a cliff.
Priced out at the exitSan Francisco
The median owner has held the same home 17-plus years — against a national norm of about eight. The city lost residents sharply after 2020 and, even as it slowly refills, remains one of the priciest on earth. The door shut behind whoever already owns.
Priced out at the entranceThe same crisis, opposite directions: Shenzhen excludes you at the exit; San Francisco at the entrance.
San Francisco's stuck-ness has a name in the data: the golden handcuffs. Low locked-in mortgage rates and a property-tax system that rewards never selling mean the people who bought before the boom have every reason to stay put and none to move. So the homes almost never come back onto the market. Prices held even through the sharp population loss after 2020. The result is a city that lost residents and stayed unaffordable at the same time. Even now that the population is slowly climbing back, the homes still aren't coming free.
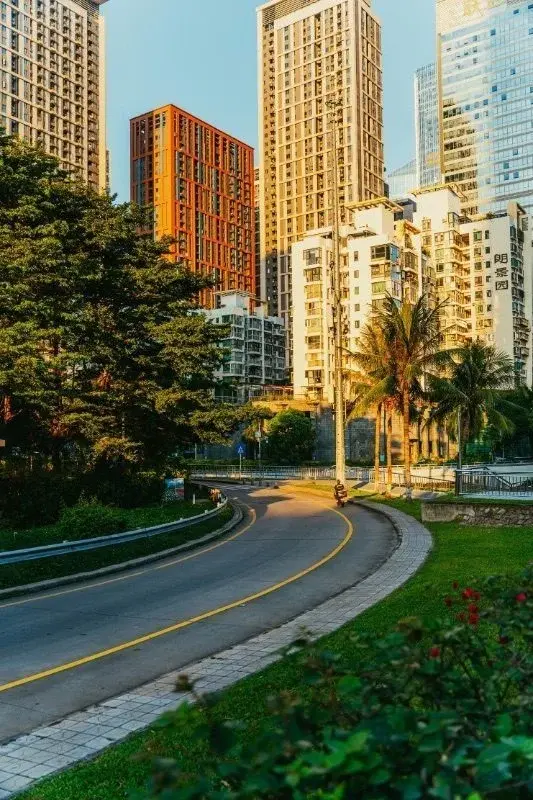 Shenzhen
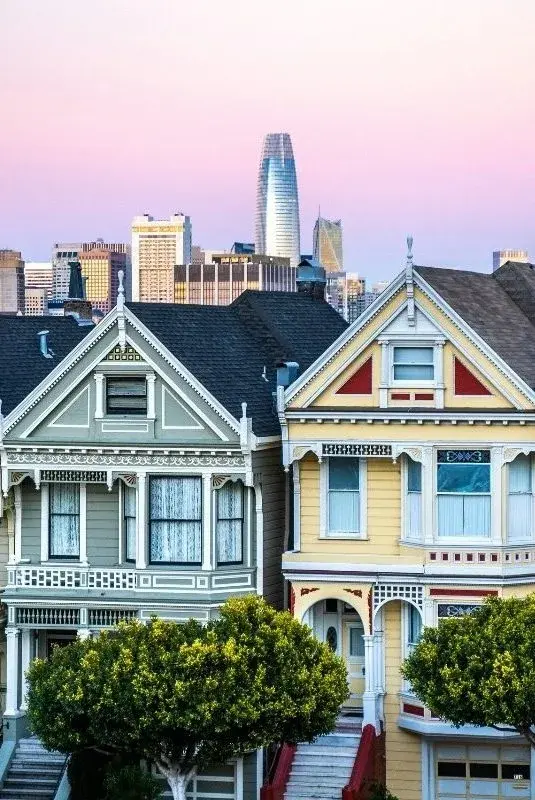 San Francisco
Shenzhen is the opposite of the San Francisco half of that pair. Nobody is locked in, because almost nobody owns from before — the city is only forty years old and its people arrived the day before yesterday. What holds them isn't a mortgage; it's a job and a decade of youth. When the mortgage stays out of reach and the 35 clock runs out, they don't sit tight like a San Franciscan does. They leave, and the next 23-year-old — some of them straight out of SUSTech, the city's own from-scratch university — takes the desk.
04 — The everyday layer
Shenzhen vs San Francisco: groceries close, homeownership far apart.
Rent and homeownership are the story so far — and they're where the two cities pull furthest apart. Underneath that, an ordinary week splits differently. And not always in the direction the rent gap would predict.
| Monthly | Shenzhen | San Francisco |
|---|---|---|
| Electricity, residential rate | ||
| Per kWh Shenzhen tiered/monthly; PG&E effective all-in | ¥0.663–0.963 · $0.092–0.134 | ≈$0.39* |
| Water, sewer & garbage, combined rate | ||
| Per m³ San Francisco derived from a per-gallon estimate | ¥4.26–12.94 · $0.59–1.80 | ≈$4.85* |
| Wet market / grocery, per item | ||
| Pork, per 500g / ~1.1lb San Francisco: national BLS average, not city-specific | ¥18.43 · $2.56 | ≈$4.39* |
| Eggs, per dozen-equivalent San Francisco: national BLS average, not city-specific | ≈¥8.2 · $1.14 | ≈$2.50* |
| Dining out and telecom | ||
| Inexpensive restaurant meal | ¥25 · $3.47 | ≈$25* |
| Mobile plan, unlimited data | ¥30–50 · $4–7 | ≈$65* |
Shenzhen electricity, water, and wet-market figures are the same directly-sourced numbers already published on the Shenzhen deep-dive — Shenzhen municipal published residential schedules, and the Shenzhen Development and Reform Commission's monthly food-price report, May 2026. *San Francisco electricity is PG&E's own March 2026 bundled residential average (a new fixed Base Services Charge, ≈$24/month, sits on top and isn't folded into the per-kWh figure); San Francisco water/sewer is derived from a published per-gallon utility estimate built on SFPUC's own FY26 rate schedule, not an independent per-unit reading. San Francisco's pork and egg rows are national BLS averages, not San Francisco-specific retail prices; Shenzhen's egg figure is converted from the deep-dive's own per-500g sourcing to a rough dozen-equivalent at roughly 60g per egg. San Francisco dining and telecom figures are compiled from multiple current cost-of-living guides rather than one single tracked source; for what a Shenzhen mobile plan and broadband actually involve day to day, see Getting Connected in China. Converted at ¥7.2 = $1.
The surprise in this layer
Wet-market groceries actually line up here — pork under 2× apart, eggs about 2.2× — even though rent runs nearly 5× apart. Electricity (≈4.2×) and the metro fare below (≈4.4×) both land close to the rent gap, almost coincidentally. But water is a wide ≈8.2×, and mobile phone plans are the widest gap on this whole page at ≈11.7× — a San Francisco unlimited plan costs more than eleven times a Shenzhen one. The pattern holds here too. Whatever's priced by a government tariff schedule stays closer to the rent gap. Whatever's sold by a private carrier or restaurant menu runs wider.
Getting around
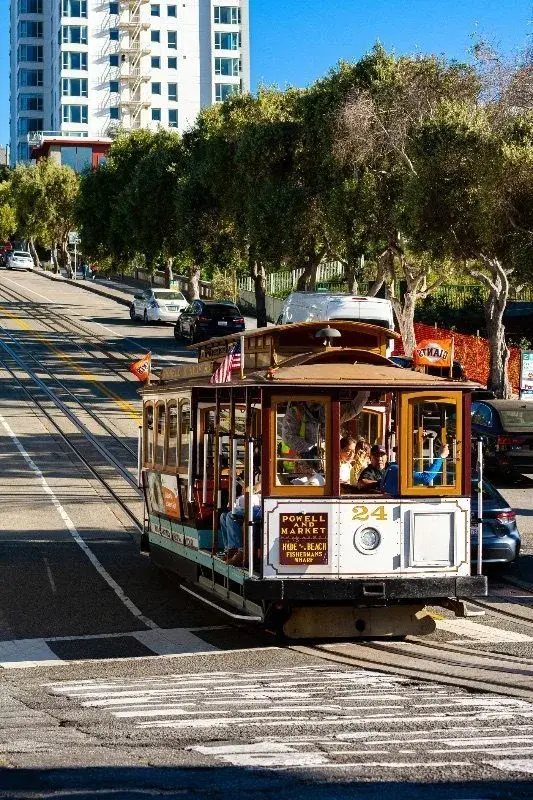
Shenzhen's metro is one of the newest, fastest-growing systems in the world. San Francisco splits its rail between a citywide light-rail network and a separate regional heavy-rail system that only partly overlaps with it. (For the national picture on China's fares, ride-hailing, and shared bikes beyond just the rail network, see Getting Around a City.)
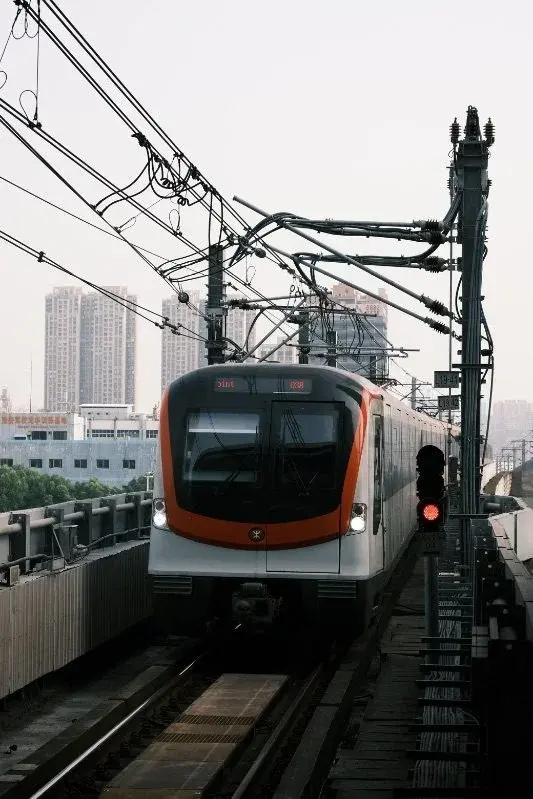 Shenzhen
 San Francisco
| Metro / light rail | Shenzhen Metro | Muni Metro |
|---|---|---|
| Route length | 555 km (345 mi) | 63 km (38.9 mi) |
| Stations | 280+ (16+ lines) | 117 (7 lines) |
| Annual ridership (2025) | not published, see note | 34.2 million |
| Fare structure | flat, ~¥2–4 to start | flat, ≈$2.50–2.75 |
| Monthly pass | ¥140 · $19.44 | $86 (Muni); $104 w/ BART |
Shenzhen Metro route length and station count are from the deep-dive's own §04, current as of 2026; a citywide annual-ridership figure specific to Shenzhen wasn't available in the sources checked for this page, so the row is left blank rather than substituted with a national or provincial estimate. Muni Metro route length, station count, and 2025 annual ridership are from Wikipedia's Muni Metro entry; fares and monthly pass prices are SFMTA's own published 2025–26 schedule. San Francisco also has BART, a separate regional heavy-rail system (131 mi / 211 km, 50 stations, 55.5 million annual rides in 2025) connecting the city to the wider Bay Area — Shenzhen has no precise equivalent split between "city" and "regional" rail, so BART is noted here rather than merged into the Muni row above it.
The monthly-pass gap (≈4.4×) tracks the rent gap (≈4.9×) about as closely as any two numbers on this page. Commuting, in both cities, is priced somewhere close to what rent is priced at. It's ownership, not any of these everyday numbers, where Shenzhen and San Francisco actually pull apart the hardest.
05 — Where the comparison breaks
Shenzhen vs San Francisco: three honest caveats.
None of the everyday numbers above change the real subject of this page. So before closing, a few qualifications. First, the machinery differs. Shenzhen rations belonging through the hukou household-registration system on top of price. San Francisco does it through price plus incumbency — rent control, low property taxes, seventeen-year tenures. Same outcome, different levers.
Second, one city has a pressure valve and the other doesn't. Shenzhen's urban villages soak up the people the market won't house — a room for ¥500–2,000 a month, wedged between the towers. The mechanics of finding one of these rooms, deposits and all, are covered in Renting an Apartment in China. San Francisco has almost no equivalent. The priced-out don't cram into cheaper rooms — they leave the city, often the state. One city stacks its low-wage workers into rooms; the other exports them.
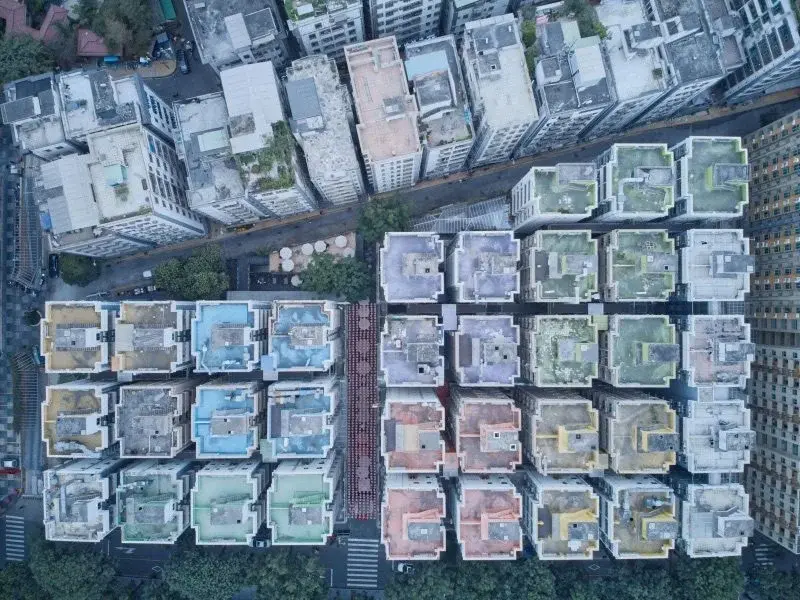
Third, direction. A city priced out but still growing and young is a fundamentally different animal from one priced out and only slowly recovering from a sharp population loss. Shenzhen's crisis is a crush of arrival; San Francisco's is a slow refill after the door already shut on affordability. They rhyme, but they are not the same season of the same story.
Affordability is a phase, not a property — it lasts exactly as long as whatever produces it.
If you're choosing between them
Two cities, two clocks
- Earning dollars? Shenzhen is several times cheaper to live in — but nearly impossible to buy into on any local wage, and priced in yuan it's one of the least affordable cities on earth.
- Earning a San Francisco tech salary? Renting is doable; owning is the wall. The median home needs an income most residents don't have.
- Both run a clock. Shenzhen's is your 35th birthday. San Francisco's is whether you bought before the boom. Miss either window and the city stops being for you.
- Neither is "cheap." One is cheap for a dollar-earner and brutal for a local; the other isn't cheap for anyone who didn't already get in.
The bottom line
Shenzhen vs San Francisco: who gets to stay?
Both do — in mirror image. Shenzhen is generous at the entrance and brutal at the exit; San Francisco shut the door decades ago and left the lights on for whoever was already inside. The question the two cities share was never how much it costs. It's who gets to stay — and each has already, quietly, answered it. If you're deciding, don't ask which is more expensive. Ask which door you're standing at, and whether the clock in that city is running for you or against you.
06 — Questions people actually ask
Quick answers
Is Shenzhen or San Francisco more expensive?
In dollar terms, San Francisco wins easily as the more expensive city. Measured against local wages, though, Shenzhen is actually the harder city to afford.
Why compare Shenzhen to San Francisco specifically?
Both are tech engines that generated enormous wealth while making themselves largely unlivable for many of the workers who built that wealth.
Are Shenzhen and San Francisco growing or shrinking?
They're diverging — Shenzhen keeps filling with young workers, while San Francisco saw a sharp population loss after 2020 and has only slowly refilled since, staying expensive regardless.
Which is harder to buy a home in — Shenzhen or San Francisco?
Homeownership is where the two cities diverge hardest — it's the single biggest structural difference between them, more than everyday costs like groceries, which are actually fairly close.
Which city ultimately prices out more of its own workers?
The comparison treats this as its central closing question rather than giving a flat answer — it depends on whether you're measuring in dollars or against each city's own local wage.